Yasuda Kinen (G1) - Data Analysis
Spring mile champion decider frequently produces six-figure payouts
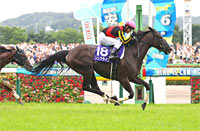
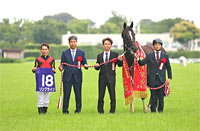
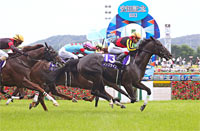
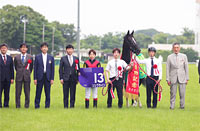
The 2017 Yasuda Kinen was won by Satono Aladdin (7th favorite) with win odds of 12.4, resulting in a substantial Trifecta payout of 283,000 yen. Payouts for the race have exceeded 100,000 yen in 10 out of 13 years since 2005, when Trifecta bets were introduced. In addition, the only JRA G1 races that have produced 10 or more payouts in excess of 100,000 yen through 2017 are the Yasuda Kinen and the Tenno Sho (Spring)(10 times). Which runner will dominate and take the crown in this mile champion decider that is known for upset victories? This time, let’s analyze some features shared by successful runners in this race based on results over the last 10 years.
Focus on runners that have mainly appeared in JRA G1 and G2 races
Of the 30 Top 3 finishers in the last 10 years, 29 (2008 runner-up Armada being the exception) had experienced a “Top 4 finish in a JRA G1 or G2 race (excluding fillies-and-mares-only races) since the previous year.” In other words, we should probably lower our expectations of runners that did not perform well in a JRA G1 or G2 race (excluding fillies-and-mares-only races) since the previous year. [Table 1]
[Table 1] Performance by experience of finishing in the Top 4 of a JRA G1 or G2 race (excluding fillies-and-mares-only races) since the previous year (last 10 years)
| Experience |
Performance
[1st-2nd-3rd-4th or lower] |
Win ratio |
Top 2 ratio |
Top 3 ratio |
| Yes |
10-9-10-101 |
7.7% |
14.6% |
22.3% |
| No |
0-1-0-41 |
0% |
2.4% |
2.4% |
Heavier horses tend to succeed
Of the 20 Top 2 finishers in the last 10 years, 16 had previously entered a JRA race at a highest weight of “500kg or more.” These runners achieved a relatively high Top 3 ratio of 25.0%, and their success ratios improved further from 2014, with performance of [4-4-3-23] (Top 3 ratio of 32.4%). This year again, we should first check whether any of the runners have appeared in races at a weight of “500kg or more.” [Table 2]
[Table 2] Performance by highest weight in a JRA race (last 10 years)
| Highest weight |
Performance
[1st-2nd-3rd-4th or lower] |
Win ratio |
Top 2 ratio |
Top 3 ratio |
| 500kg or more |
8-8-4-60 |
10.0% |
20.0% |
25.0% |
| Below 500kg |
2-1-6-74 |
2.4% |
3.6% |
10.8% |
| First JRA race |
0-1-0-8 |
0% |
11.1% |
11.1% |
Check the “closing speed” last time out
Of the 20 Top 2 finishers in the last 10 years, 11 had appeared in a JRA race last time out and were ranked “2nd or higher” in their estimated time over the final three furlongs in that race. These runners also achieved an excellent Top 3 ratio of 34.1%. When comparing the pre-race schedule of this year’s runners, we should focus on their “closing speed.” [Table 3]
[Table 3] For runners that had appeared in a JRA race last time out, performance by ranking in their (estimated) final three furlongs (last 10 years)
Ranking in estimated final
three furlongs last time out |
Performance
[1st-2nd-3rd-4th or lower] |
Win ratio |
Top 2 ratio |
Top 3 ratio |
| 2nd or higher |
7-4-4-29 |
15.9% |
25.0% |
34.1% |
| 3rd or lower |
2-4-6-92 |
1.9% |
5.8% |
11.5% |
In addition, for runners that had appeared in a JRA race last time out and were ranked “3rd or lower” in their estimated time over the final three furlongs in that race, those that had no experience of finishing in the Top 2 of a “1,600m JRA G1 race (excluding fillies-and-mares-only races)” were all beaten to 3rd or lower. We can therefore expect little from runners that were not ranked highly in terms of their closing speed in their previous race, and have no experience of finishing in the Top 2 of a major 1,600m race. [Table 4]
[Table 4] For runners that had appeared in a JRA race last time out and were ranked “3rd or lower” in their estimated time over the final three furlongs in that race, performance by experience of finishing in the Top 2 of a “1,600m JRA G1 race (excluding fillies-and-mares-only races)” (last 10 years)
| Top 2 experience |
Performance
[1st-2nd-3rd-4th or lower] |
Win ratio |
Top 2 ratio |
Top 3 ratio |
| Yes |
2-4-2-22 |
6.7% |
20.0% |
26.7% |
| No |
0-0-4-70 |
0% |
0% |
5.4% |
Watch runners’ performance in major prep races
Of the 172 runners that appeared in the Yasuda Kinen in the last 10 years, 39 contested their previous race in the Keio Hai Spring Cup and 42 in the Yomiuri Milers Cup, and Top 3 ratios for both groups were below 20%. In other words, runners that have appeared in major warmup races do not seem to perform well in this race. [Table 5]
[Table 5] Performance by previous race (last 10 years)
| Previous race |
Performance
[1st-2nd-3rd-4th or lower] |
Win ratio |
Top 2 ratio |
Top 3 ratio |
| Keio Hai Spring Cup |
2-3-2-32 |
5.1% |
12.8% |
17.9% |
| Yomiuri Milers Cup |
0-1-7-34 |
0% |
2.4% |
19.0% |
| Other race |
8-6-1-76 |
8.8% |
15.4% |
16.5% |
In addition, for runners that had entered the Keio Hai Spring Cup last time out, those that had been ranked “3rd or lower” in their estimated time over the final three furlongs in that race, were all beaten to 4th or lower. When comparing runners that contested their previous race in the Keio Hai Spring Cup, we should pay particular attention to their “closing speed” in that race. [Table 6]
[Table 6] For runners that had entered the Keio Hai Spring Cup last time out, performance by ranking in their estimated time over the final three furlongs in that race (last 10 years)
Ranking in estimated final
three furlongs last time out |
Performance
[1st-2nd-3rd-4th or lower] |
Win ratio |
Top 2 ratio |
Top 3 ratio |
| 2nd or higher |
2-3-2-7 |
14.3% |
35.7% |
50.0% |
| 3rd or lower |
0-0-0-25 |
0% |
0% |
0% |
In addition, for runners that had entered the Yomiuri Milers Cup last time out, those that had finished “2nd or higher” in that race were all beaten to 4th or lower in the Yasuda Kinen. In other words, we should not expect too much from runners that have finished in the Top 2 of the Yomiuri Milers Cup. [Table 7]
[Table 7] For runners that had entered the Yomiuri Milers Cup last time out, performance by finish in that race (last 10 years)
| Finish in previous race |
Performance
[1st-2nd-3rd-4th or lower] |
Win ratio |
Top 2 ratio |
Top 3 ratio |
| 2nd or higher |
0-0-0-13 |
0% |
0% |
0% |
| 3rd or lower |
0-1-7-21 |
0% |
3.4% |
27.6% |
Runners starting in inner brackets struggling in recent years
Looking at performances by bracket number over the last four years, runners starting in “Bracket 1,” “Bracket 2,” and “Bracket 4” were all beaten to 4th or lower. For runners that started in “Bracket 3,” the only Top 3 finishers were 2015 winner Maurice (1st favorite) and 2017 third-place finisher Red Falx (3rd favorite). If trends in recent years are anything to go by, we should lower our expectations of runners starting in the inner brackets. [Table 8]
[Table 8] Performance by bracket number (last four years)
| Bracket number |
Performance
[1st-2nd-3rd-4th or lower] |
Win ratio |
Top 2 ratio |
Top 3 ratio |
| 1 |
0-0-0-7 |
0% |
0% |
0% |
| 2 |
0-0-0-7 |
0% |
0% |
0% |
| 3 |
1-0-1-5 |
14.3% |
14.3% |
28.6% |
| 4 |
0-0-0-7 |
0% |
0% |
0% |
| 5 |
2-0-0-6 |
25.0% |
25.0% |
25.0% |
| 6 |
0-2-2-4 |
0% |
25.0% |
50.0% |
| 7 |
1-1-1-6 |
11.1% |
22.2% |
33.3% |
| 8 |
0-1-0-10 |
0% |
9.1% |
9.1% |
Seek out the winner
Discount runners that have entered a G1 race since the turn of the year
None of the last four winners had entered “a JRA G1 race in the same year.” Up to 2013, runners that had entered “a JRA G1 race in the same year” performed well. Since 2014, however, we note that such runners have delivered performance of [0-0-1-13] (Top 3 ratio of 7.1%) and produced zero Top 2 finishers. Other features shared by the four winners were that they all had finished in the Top 4 of “a JRA G1 or G2 race (excluding fillies-and-mares only races) since the previous year,” and had entered a JRA race with a highest weight of 500kg or more. In other words, in addition to the appearance in a JRA G1 race in the same year, we also need to watch other trends as shown in [Table 1] and [Table 2]. [Table 9]
[Table 9] Winners’ “most recent appearance in JRA G1 race,” “highest finish in a JRA G1 or G2 race (excluding fillies-and-mares only races) since the previous year,” and “highest weight in a JRA race” (last four years)
| Year |
Winner |
Most recent appearance
in JRA G1 race |
Highest finish in JRA G1 or G2 race
(excluding fillies-and-mares only
races) since the previous year |
Highest
weight in
JRA race |
| 2014 |
Just a Way |
2013 Tenno Sho
(Autumn) |
1st (2014 Nakayama Kinen, etc.) |
506kg |
| 2015 |
Maurice |
No such race entered |
4th (2014 Fuji TV Sho Spring Stakes
(Japanese 2000 Guineas Trial)) |
510kg |
| 2016 |
Logotype |
2015 Mile Championship |
2nd (2015 Nakayama Kinen) |
502kg |
| 2017 |
Satono Aladdin |
2016 Mile Championship |
1st (2016 Swan Stakes, etc.) |
534kg |
(Masaya Ibuki)
|


