Oka Sho (Japanese 1000 Guineas) (G1) - Data Analysis
First fillies classic known for upsets
The 2017 Oka Sho (Japanese 1000 Guineas) was won by 8th favorite Reine Minoru with odds of 40.8. In 2008, 12th favorite Reginetta triumphed, producing a massive Trifecta payout of 7,002,920 yen. In other words, the Oka Sho is a G1 race with a history of upsets. Incidentally, of the last 10 winners, only three runners notched a win in their previous outing. Conversely, eight of the last 10 winners of next week’s classic Satsuki Sho (Japanese 2000 Guineas), first leg of the Triple Crown, achieved a victory in their previous race. Compared with the Satsuki Sho, rebound performances by runners that suffered a defeat last time out are more common in the Oka Sho. This time, let’s analyze some features shared by successful runners in this race based on results over the last 10 years.
Shorter careers provide best performances
Looking at performances by total career starts over the last 10 years, we observe that runners with “4 or fewer” career starts achieved a Top 3 ratio of 30.9%, a strong performance. On the other hand, runners with “7 or more” career starts produced zero winners, while runners with “5 or 6” career starts had a Top 3 ratio of only 14.1%. In other words, we should place a premium on runners with fewer career starts. [Table 1]
[Table 1] Performance by total career starts (last 10 years)
| Total career starts |
Performance
[1st-2nd-3rd-4th or lower] |
Win ratio |
Top 2 ratio |
Top 3 ratio |
| 2 |
0-1-0-2 |
0% |
33.3% |
33.3% |
| 3 |
2-3-1-12 |
11.1% |
27.8% |
33.3% |
| 4 |
4-2-4-24 |
11.8% |
17.6% |
29.4% |
| 5 |
2-1-2-40 |
4.4% |
6.7% |
11.1% |
| 6 |
2-2-3-33 |
5.0% |
10.0% |
17.5% |
| 7 |
0-0-0-17 |
0% |
0% |
0% |
| 8 |
0-1-0-8 |
0% |
11.1% |
11.1% |
| 9 |
0-0-0-8 |
0% |
0% |
0% |
| 10 |
0-0-0-2 |
0% |
0% |
0% |
| 11 |
0-0-0-1 |
0% |
0% |
0% |
| 13 |
0-0-0-1 |
0% |
0% |
0% |
| 4 or fewer |
6-6-5-38 |
10.9% |
21.8% |
30.9% |
| 5 or 6 |
4-3-5-73 |
4.7% |
8.2% |
14.1% |
| 7 or more |
0-1-0-37 |
0% |
2.6% |
2.6% |
In addition, of the runners with either “5 or 6” or “7 or more” careers starts, those that had not experienced a Top 3 finish in the Hanshin Juvenile Fillies struggled, achieving a Top 3 ratio of only 6.5%. In the seven years from 2011, performance for these runners was [0-0-1-69] (Top 3 ratio of 1.4%), with zero Top 2 finishers. In other words, we should probably lower our expectations of runners that have not excelled in the Hanshin Juvenile Fillies and have “5 or more” career starts. [Table 2]
[Table 2] Performance by finish in Hanshin Juvenile Fillies for runners with “5 or 6” or “7 or more” career starts (last 10 years)
| Finish |
Performance
[1st-2nd-3rd-4th or lower] |
Win ratio |
Top 2 ratio |
Top 3 ratio |
| Top 3 |
3-2-1-10 |
12.5% |
31.3% |
37.5% |
4th or lower,
no appearance |
1-2-4-100 |
0.9% |
2.8% |
6.5% |
Runners that appeared in the Tulip Sho are strong performers
Of the 30 Top 3 finishers in the last 10 years, 17 contested their previous race in the “Tulip Sho”. Runners that appeared in the “Tulip Sho” achieved a Top 3 ratio of 38.6%, an excellent success ratio. This year again, we should start by focusing on runners that contested the Tulip Sho in their previous outing. [Table 3]
[Table 3] Performance by previous race (last 10 years)
| Previous race |
Performance
[1st-2nd-3rd-4th or lower] |
Win ratio |
Top 2 ratio |
Top 3 ratio |
| Tulip Sho |
7-4-6-27 |
15.9% |
25.0% |
38.6% |
| Hochi Hai Fillies’ Revue |
2-0-2-52 |
3.6% |
3.6% |
7.1% |
| Elfin Stakes |
1-1-0-2 |
25.0% |
50.0% |
50.0% |
| Daily Hai Queen Cup |
0-3-0-14 |
0% |
17.6% |
17.6% |
| Flower Cup |
0-1-1-10 |
0% |
8.3% |
16.7% |
| Hanshin Juvenile Fillies |
0-1-0-2 |
0% |
33.3% |
33.3% |
| Anemone Stakes |
0-0-1-23 |
0% |
0% |
4.2% |
| Other races |
0-0-0-18 |
0% |
0% |
0% |
In addition, runners that contested a race other than the “Tulip Sho” last time out and finished “4th or lower” in that race struggled, achieving a Top 3 ratio of only 1.8%. Runners that finished “2nd” or “3rd” in such a previous race had a Top 3 ratio of under 10%. Accordingly, there seems to be little prospect of top places being secured by runners that contested a race other than the “Tulip Sho” last time out and finished 2nd or lower in that race. [Table 4]
[Table 4] Performance by finish last time out for runners whose previous race was not the Tulip Sho (last 10 years)
| Finish in previous race |
Performance
[1st-2nd-3rd-4th or lower] |
Win ratio |
Top 2 ratio |
Top 3 ratio |
| 1st |
1-5-3-32 |
2.4% |
14.6% |
22.0% |
| 2nd |
1-0-1-24 |
3.8% |
3.8% |
7.7% |
| 3rd |
1-0-0-11 |
8.3% |
8.3% |
8.3% |
| 4th or lower |
0-1-0-54 |
0% |
1.8% |
1.8% |
Zero Top 2 finishers among runners with horse numbers 1-5 in over 20 years
Looking at performances by horse number over the last 10 years, we find that runners with “numbers 1-5” have produced zero Top 2 finishers and only one Top 3 finisher (Contessa Thule in 2015). Incidentally, the last runner with a number between 1 and 5 to achieve a Top 2 finish was 1996 winner Fight Gulliver. Consequently, we should not expect too much from runners that start the race with numbers positioned near the inside rail. [Table 5]
[Table 5] Performance by horse number (last 10 years)
| Horse number |
Performance
[1st-2nd-3rd-4th or lower] |
Win ratio |
Top 2 ratio |
Top 3 ratio |
| No. 1 |
0-0-1-9 |
0% |
0% |
10.0% |
| No. 2 |
0-0-0-10 |
0% |
0% |
0% |
| No. 3 |
0-0-0-9 |
0% |
0% |
0% |
| No. 4 |
0-0-0-10 |
0% |
0% |
0% |
| No. 5 |
0-0-0-10 |
0% |
0% |
0% |
| No. 6 |
1-1-0-8 |
10.0% |
20.0% |
20.0% |
| No. 7 |
1-1-0-7 |
11.1% |
22.2% |
22.2% |
| No. 8 |
1-1-0-8 |
10.0% |
20.0% |
20.0% |
| No. 9 |
2-0-1-7 |
20.0% |
20.0% |
30.0% |
| No. 10 |
2-0-2-6 |
20.0% |
20.0% |
40.0% |
| No. 11 |
0-0-2-8 |
0% |
0% |
20.0% |
| No. 12 |
0-2-0-8 |
0% |
20.0% |
20.0% |
| No. 13 |
1-0-1-8 |
10.0% |
10.0% |
20.0% |
| No. 14 |
0-1-1-8 |
0% |
10.0% |
20.0% |
| No. 15 |
1-1-1-7 |
10.0% |
20.0% |
30.0% |
| No. 16 |
0-1-0-9 |
0% |
10.0% |
10.0% |
| No. 17 |
0-0-1-9 |
0% |
0% |
10.0% |
| No. 18 |
1-2-0-7 |
10.0% |
30.0% |
30.0% |
| No. 1-5 |
0-0-1-48 |
0% |
0% |
2.0% |
| No. 6-18 |
10-10-9-100 |
7.8% |
15.5% |
22.5% |
Check runners with success in Tokyo, Kyoto, or Hanshin races
Of the 30 Top 3 finishers in the last 10 years, 25 experienced a Top 2 finish in an “open-class race held at the Tokyo, Kyoto, or Hanshin Racecourse”. Conversely, runners without such experience had a Top 3 ratio of only 6.3%, and in the seven years since 2011, such runners were unable to rise to the top with performance of [0-0-0-54]. In other words, we should focus on runners with a favorable track record in one of the four big racecourses other than Nakayama. [Table 6]
[Table 6] Performance by Top 2 experience in open-class race held at the Tokyo, Kyoto, or Hanshin Racecourse (last 10 years)
| Top 2 experience |
Performance
[1st-2nd-3rd-4th or lower] |
Win ratio |
Top 2 ratio |
Top 3 ratio |
| Yes |
9-8-8-73 |
9.2% |
17.3% |
25.5% |
| No |
1-2-2-75 |
1.3% |
3.8% |
6.3% |
In addition, the 15 Top 3 finishers over the last five years all experienced a Top 2 finish in an “open-class race held at the Tokyo, Kyoto, or Hanshin Racecourse” in which they passed the 4th corner in 5th or lower position. This means that we may need to lower our expectations of runners that experienced a Top 2 finish in an “open-class race held at the Tokyo, Kyoto, or Hanshin Racecourse” but only achieved such success after taking a front position. [Table 7]
[Table 7] Performance by Top 2 finish experience in an open-class race held at the Tokyo, Kyoto, or Hanshin Racecourse after passing the 4th corner in 5th or lower position (last five years)
| Top 2 experience |
Performance
[1st-2nd-3rd-4th or lower] |
Win ratio |
Top 2 ratio |
Top 3 ratio |
| Yes |
5-5-5-23 |
13.2% |
26.3% |
39.5% |
| No |
0-0-0-51 |
0% |
0% |
0% |
Runners that suffered defeats in non-graded races struggle in recent years
Of the 15 Top 3 finishers in the last five years, 12 runners were never beaten to 2nd or lower position in races other than JRA graded races. Conversely, runners that had suffered such defeats struggled, achieving a Top 3 ratio of only 5.3%. If trends in recent years are anything to go by, we may have to lower our expectations of runners who have been defeated in non-graded races. [Table 8]
[Table 8] Performance by 2nd or lower finish experience in races other than JRA graded races (last five years)
| Experience |
Performance
[1st-2nd-3rd-4th or lower] |
Win ratio |
Top 2 ratio |
Top 3 ratio |
| Yes |
0-2-1-54 |
0% |
3.5% |
5.3% |
| No |
5-3-4-20 |
15.6% |
25.0% |
37.5% |
Seek out the winner!
Winners in last five years previously had entered only newcomer and graded races
The five last winners were all runners that had never suffered defeats in races other than JRA graded races and whose total career record in such races was “one start, one win” (i.e., newcomer in debut outing). In other words, the five recent winners did not even have experience other than newcomer and graded races. If any of this year’s runners meet these criteria (win in debut race followed by appearances only in graded races), it would be wise to take a closer look. Moreover, the five last winners also had the following characteristics in common: (1) “6 or fewer” total career starts, (2) horse numbers 6-18, and (3) Top 2 experience in graded race held at the Tokyo, Kyoto, or Hanshin Racecourses after passing the 4th corner in 5th or lower position. In other words, we should also focus on the trends shown in [Table 1], [Table 5], and [Table 7]. [Table 9]
[Table 9] Winners’ lowest finish in races other than JRA graded races, total career starts, horse number, highest finish in a graded race held at the Tokyo, Kyoto, or Hanshin Racecourses after passing 4th corner in 5th or later position (last five years)
| Year |
Winner |
Lowest finish in
races other than JRA graded races |
Career
starts |
Horse number |
Highest finish in graded race held at the Tokyo, Kyoto, or Hanshin Racecourses after passing 4th corner in 5th or lower position |
| 2013 |
Ayusan |
1st (1 start, 1 win) |
4 |
No. 7 |
2nd (Artemis Stakes) |
| 2014 |
Harp Star |
1st (1 start, 1 win) |
4 |
No. 18 |
1st (Tulip Sho) |
| 2015 |
Let’s Go Donki |
1st (1 start, 1 win) |
5 |
No. 6 |
2nd (Hanshin Juvenile Fillies, etc.) |
| 2016 |
Jeweler |
1st (1 start, 1 win) |
3 |
No. 13 |
2nd (Tulip Sho, etc.) |
| 2017 |
Reine Minoru |
1st (1 start, 1 win) |
6 |
No. 10 |
2nd (Hochi Hai Fillies’ Revue) |
(Masaya Ibuki) |

- Preview
- Barrier draw
- Past performances of runners

- News
- Race result
- Video
- 2024 English

- 2023 English
- 2022 English
- 2021 English
- 2020 English
- 2019 English
- 2018 English
- 2017 English
- 2016 English
- 2015 English
- 2014 English
- 2013 English
- Photo Gallery
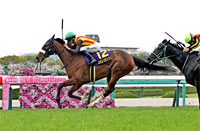
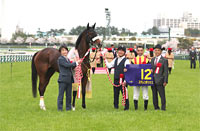
2024 Winner: Stellenbosch
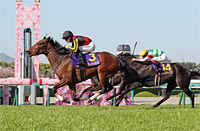
2023 Winner: Liberty Island
|
")


 (G1)','../en/racing/news_media/gallery/img/2024/s2/240407a.jpg','../en/racing/news_media/gallery/img/2024/b/240407a.jpg'))
 (G1)','../en/racing/news_media/gallery/img/2024/s2/240407b.jpg','../en/racing/news_media/gallery/img/2024/b/240407b.jpg'))
 (G1)','../en/racing/news_media/gallery/img/2023/s2/230409a.jpg','../en/racing/news_media/gallery/img/2023/b/230409a.jpg'))
 (G1)','../en/racing/news_media/gallery/img/2023/s2/230409b.jpg','../en/racing/news_media/gallery/img/2023/b/230409b.jpg'))
