Tokyo Yushun (Japanese Derby) (G1) - Data Analysis
First champion decider of the Reiwa era
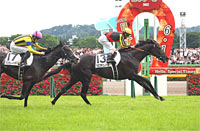
Last year’s Tokyo Yushun (Japanese Derby) was won by Wagnerian with win odds of 12.5 (5th favorite), Epoca d'Oro finished as runner-up with win odds of 10.5 (4th favorite), and Cosmic Force in third place with win odds of 223.7 (16th favorite), resulting in a massive Trifecta payout of 2,856,300 yen. This marked the first seven-figure payout (Trifecta odds exceeding 10,000) in 11 years since 2007 (winner: Vodka) and the first time a runner backed as 4th favorite or lower won the race in eight years since 2010 (winner: Eishin Flash), and the first time that runners backed as 1st, 2nd, and 3rd favorite were all beaten to 4th or lower in the 31 years since 1987 (winner: Merry Nice). This year again, the big question is whether one of the fancied runners will live up to expectations, or whether the race will result in a major upset for the second straight year. Let’s now analyze some features shared by successful runners in this race based on results over the last 10 years.
Horses with a change of jockey have not produced a winner since 1985
All winners over the last 10 years contested their previous race with “the same jockey.” Conversely, runners that contested their previous race with “a different jockey” have struggled with a Top 3 ratio of 8.6%. In addition, the last runner to win the Tokyo Yushun with “a different jockey” from the previous race was Sirius Symboli in 1985. In other words, we need to discount horses that contest the race with “a different jockey” from the previous race. [Table 1]
[Table 1] Performance by jockey in previous race (last 10 years)
Jockey in
previous race |
Performance
[1st-2nd-3rd-4th or lower] |
Win ratio |
Top 2 ratio |
Top 3 ratio |
| Same jockey |
10-8-7-95 |
8.3% |
15.0% |
20.8% |
| Different jockey |
0-2-3-53 |
0% |
3.4% |
8.6% |
Watch distance aptitude
The 20 Top 2 finishers over the last 10 years all had experience of winning “an 1,800m+ graded race at one of the four major JRA racecourses (Tokyo, Nakayama, Kyoto, and Hanshin Racecourses).” Conversely, runners without such experience struggled with a Top 3 ratio of 4.0%. In other words, we should focus on runners that have triumphed in a middle- to long-distance graded race held at one of the four major JRA venues. [Table 2]
[Table 2] Performance by experience of winning “an 1,800m+ graded race at one of the four major JRA racecourses” (last 10 years)
| Winning experience |
Performance
[1st-2nd-3rd-4th or lower] |
Win ratio |
Top 2 ratio |
Top 3 ratio |
| Yes |
10-10-6-51 |
13.0% |
26.0% |
33.8% |
| No |
0-0-4-97 |
0% |
0% |
4.0% |
In addition, 25 of the 30 Top 3 finishers over the last 10 years had experience of winning “a 2,000m+ JRA race contested by 10 or more runners.” Conversely, runners without such experience struggled with a Top 3 ratio of 6.0%, and were all beaten to 4th or lower in the four years since 2015 (performance of [0-0-0-30]). This suggests we should lower our expectations of runners that have not won a 2,000m+ race (excluding small-field races). [Table 3]
[Table 3] Performance by experience of winning “a 2,000m+ JRA race contested by 10 or more runners” (last 10 years)
| Winning experience |
Performance
[1st-2nd-3rd-4th or lower] |
Win ratio |
Top 2 ratio |
Top 3 ratio |
| Yes |
9-8-8-69 |
9.6% |
18.1% |
26.6% |
| No |
1-2-2-79 |
1.2% |
3.6% |
6.0% |
Previous race and finish in that race are key
Of the 30 Top 3 finishers over the last 10 years, 20 had contested the Satsuki Sho (Japanese 2000 Guineas) in their previous race. This year, we should again focus on runners coming straight from the Satsuki Sho. [Table 4]
[Table 4] Performance by previous race (last 10 years)
| Previous race |
Performance
[1st-2nd-3rd-4th or lower] |
Win ratio |
Top 2 ratio |
Top 3 ratio |
Satsuki Sho
(Japanese 2000 Guineas) |
9-7-4-65 |
10.6% |
18.8% |
23.5% |
Race other than
Satsuki Sho |
1-3-6-83 |
1.1% |
4.3% |
10.8% |
In addition, among runners that had contested the “Satsuki Sho” in their previous race, those that finished “7th or higher” in that race achieved an excellent Top 3 ratio of 32.7%. In other words, we should raise our expectations of runners that have finished 7th or higher in the “Satsuki Sho,” which is the first leg of the Triple Crown. [Table 5]
[Table 5] Among runners that contested the “Satsuki Sho” in their previous race, performance by finish in that race (last 10 years)
Finish in
previous race |
Performance
[1st-2nd-3rd-4th or lower] |
Win ratio |
Top 2 ratio |
Top 3 ratio |
| 7th or higher |
8-6-3-35 |
15.4% |
26.9% |
32.7% |
| 8th or lower |
1-1-1-30 |
3.0% |
6.1% |
9.1% |
Meanwhile, among runners that contested “a race other than the Satsuki Sho” in their previous race, those that finished “2nd or lower” in that race produced zero winners, had a Top 3 ratio of only 5.2%, and delivered performance of [0-0-0-24] in the four years since 2015. This suggests we should lower our expectations of runners that contested “a race other than the Satsuki Sho” in their previous race and did not achieve a victory in that race. [Table 6]
[Table 6] Among runners that contested “a race other than the Satsuki Sho” in their previous race, performance by finish in that race (last 10 years)
Finish in
previous race |
Performance
[1st-2nd-3rd-4th or lower] |
Win ratio |
Top 2 ratio |
Top 3 ratio |
| 1st |
1-3-3-28 |
2.9% |
11.4% |
20.0% |
| 2nd or lower |
0-0-3-55 |
0% |
0% |
5.2% |
Runners with long careers struggle
Of the 30 Top 3 finishers over the last 10 years, 26 had “6 or less” career starts. Conversely, runners with “7 or more” career starts struggled with a Top 3 ratio of 6.6%. In other words, we should lower our expectations of runners with long careers. [Table 7]
[Table 7] Performance by total career starts (last 10 years)
| Total career starts |
Performance
[1st-2nd-3rd-4th or lower] |
Win ratio |
Top 2 ratio |
Top 3 ratio |
| 6 or less |
8-9-9-91 |
6.8% |
14.5% |
22.2% |
| 7 or more |
2-1-1-57 |
3.3% |
4.9% |
6.6% |
In addition, 11 of the 12 Top 3 finishers over the last four years (the exception being 2015 runner-up Satono Rasen) had “5 or less” career starts. If trends in recent years are anything to go by, we should lower our expectations not only of runners with 7 or more career starts, but also those with 6 career starts. [Table 8]
[Table 8] Performance by number of career starts (last 4 years)
| Career starts |
Performance
[1st-2nd-3rd-4th or lower] |
Win ratio |
Top 2 ratio |
Top 3 ratio |
| 5 or less |
4-3-4-27 |
10.5% |
18.4% |
28.9% |
| 6 or more |
0-1-0-33 |
0% |
2.9% |
2.9% |
Off-pace horses have been strong performers in recent years
The 12 Top 3 finishers over the last four years all contested as their previous race “a JRA race in which they were ranked ‘5th or higher’ in their estimated time over the final three furlongs.” When comparing the details of the previous race, we need to focus not only on the finish but also on the “closing speed.” [Table 9]
[Table 9] Among runners that contested a “JRA race” in their previous race, performance by ranking in estimated time over final three furlongs in that race (last 4 years)
Ranking by estimated time
over final three furlongs |
Performance
[1st-2nd-3rd-4th or lower] |
Win ratio |
Top 2 ratio |
Top 3 ratio |
| 5th or higher |
4-4-4-28 |
10.0% |
20.0% |
30.0% |
| 6th or lower |
0-0-0-31 |
0% |
0% |
0% |
In addition, the 12 Top 3 finishers over the last four years were all positioned “4th or lower” when passing the 4th corner in their previous race. Up to 2014, runners that were positioned “3rd or higher” when passing the 4th corner in their previous race produced many strong performers, but if trends in recent years are anything to go by, off-pace runners have the edge. [Table 10]
[Table 10] Performance by position when passing the 4th corner in previous race (last 4 years)
Position when passing 4th
corner in previous race |
Performance
[1st-2nd-3rd-4th or lower] |
Win ratio |
Top 2 ratio |
Top 3 ratio |
| 3rd or higher |
0-0-0-19 |
0% |
0% |
0% |
| 4th or lower |
4-4-4-41 |
7.5% |
15.1% |
22.6% |
Seek out the winner!
Focus on runners with fewest reasons for uncertainty
The last four winners all contested their previous race with the same jockey. Other features shared by the winners were that they had experience of winning “an 1,800m+ graded race at one of the four major JRA racecourses,” that they had experience of winning “a 2,000m+ JRA race contested by 10 runners or more,” that they had contested the Satsuki Sho in their previous race, that they had 5 or less career starts, that they were ranked 5th or higher in the estimated time over the final three furlongs in their previous race, and that they that were positioned 7th or lower when passing the 4th corner in their previous race. In other words, any runners that clear many of the conditions in Table 1 to Table 10 should be regarded as leading contenders. [Table 11]
[Table 11] Winners’ “jockey,” “previous jockey,” “highest finish in 1,800m+ graded race at one of the four major JRA racecourses,” “highest finish in 2,000m+ JRA race contested by 10 runners or more,” “previous race,” “total career starts,” “ranking in estimated time over final three furlongs in previous race,” and “position when passing 4th corner in previous race” (last 4 years)
| Year |
Winner |
Jockey |
Jockey in previous race |
Highest finish in 1,800m+ graded race at one of 4 major JRA venues |
Highest finish in 2,000m+ JRA race contested by 10+ runners |
Previous race |
Total career starts |
Ranking of final 3F estimated time in previous race |
Position when passing 4th corner in previous race |
| 2015 |
Duramente |
M.Demuro |
M. Demuro |
1st (2015 Satsuki Sho) |
1st (2015 Satsuki Sho |
Satsuki Sho |
5 |
1st |
7th |
| 2016 |
Makahiki |
Y. Kawada |
Y. Kawada |
1st (2016 Yayoi Sho) |
1st (2016 Yayoi Sho) |
Satsuki Sho |
4 |
1st |
13th |
| 2017 |
Rey de Oro |
C. Lemaire |
C. Lemaire |
1st (2016 Hopeful Stakes) |
1st (2016 Hopeful Stakes, etc.) |
Satsuki Sho |
4 |
2nd |
14th |
| 2018 |
Wagnerian |
Y. Fukunaga |
Y. Fukunaga |
1st (2017 Tokyo Sports Hai Nisai Stakes) |
1st (2017 2yo newcomer) |
Satsuki Sho |
5 |
5th |
12th |
(Masaya Ibuki)
|


