Hanshin Juvenile Fillies (G1) - Data Analysis
Champion 2-year-old filly decider that rarely delivers upsets
Trifecta payouts for the Hanshin Juvenile Fillies have been unimpressive in recent years (JPY4,250 in 2016, JPY8,560 yen in 2017, and JPY5,020 yen in 2018). Looking back at the 15 races since 2004, when Trifecta bets were introduced, payouts have exceeded JPY1 million only once (2012) and surpassed JPY100,000 only twice (2012 and 2005). This year again, the big question is whether highly favored runners will befittingly dominate the top places, or whether a dark horse will take us all by surprise, resulting in a higher payout. Let’s now analyze some features shared by successful runners in this race based on results over the last 10 years.
Focus on runners with stable race record
Of the 30 Top 3 finishers over the last 10 years, 26 had no experience of being beaten to 4th or lower in a “JRA race.” Conversely, runners with such experience struggled with a Top 3 ratio of 4.0%. When looking at the track record of this year’s runners, we should raise our expectations of runners that have not been beaten to 4th or lower. [Table 1]
[Table 1] Performance by experience of being beaten to 4th or lower in “JRA race” (last 10 years)
| Experience |
Performance
[1st-2nd-3rd-4th or lower] |
Win
ratio |
Top 2
ratio |
Top 3
ratio |
| Yes |
0-3-1-95 |
0% |
3.0% |
4.0% |
| No |
10-7-9-55 |
12.3% |
21.0% |
32.1% |
Watch runners that have won a race over a mile or longer
Of the 30 Top 3 finishers over the last 10 years, 25 had experience of winning a “1,600m+ JRA race.” Conversely, runners without such experience struggled with a Top 3 ratio of 5.3%. In other words, we should lower our expectations of runners that have only won races of 1,600m or less. [Table 2]
[Table 2] Performance by experience of winning “1,600m+ JRA race” (last 10 years)
Winning
experience |
Performance
[1st-2nd-3rd-4th or lower] |
Win
ratio |
Top 2
ratio |
Top 3
ratio |
| Yes |
10-8-7-61 |
11.6% |
20.9% |
29.1% |
| No |
0-2-3-89 |
0% |
2.1% |
5.3% |
Runners that have contested longer races in previous outing perform better
If we analyze performance by distance of the previous race (and exclude the only runner that contested a 2,000m race last time out), the groups that produced the highest Win ratios, Top 2 ratios, and Top 3 ratios were, in descending order, runners that contested an 1,800, 1,600m, 1,400m, and 1,200m race in their previous outing. When comparing the lead-up races of this year’s runners, we should raise our expectations of runners that have contested longer races in their previous outing. [Table 3]
[Table 3] Performance by distance of previous race (last 10 years)
Distance of
previous race |
Performance
[1st-2nd-3rd-4th or lower] |
Win
ratio |
Top 2
ratio |
Top 3
ratio |
| 1,200m |
0-0-0-18 |
0% |
0% |
0% |
| 1,400m |
3-4-5-64 |
3.9% |
9.2% |
15.8% |
| 1,600m |
5-5-5-60 |
6.7% |
13.3% |
20.0% |
| 1,800m |
2-1-0-7 |
20.0% |
30.0% |
30.0% |
| 2,000m |
0-0-0-1 |
0% |
0% |
0% |
Runners competing after two weeks or less since previous race struggle
Of the 30 Top 3 finishers over the last 10 years, 27 competed after “3 weeks or more” since their previous race. Conversely, runners that competed after “2 weeks or less” since their previous race struggled with a Top 3 ratio of 6.4%. This suggests we should not expect too much from runners that compete after short time intervals since their previous race. [Table 4]
[Table 4] Performance by time interval since previous race (last 10 years)
Time interval since
previous race |
Performance
[1st-2nd-3rd-4th or lower] |
Win
ratio |
Top 2
ratio |
Top 3
ratio |
| 2 weeks or less |
1-1-1-44 |
2.1% |
4.3% |
6.4% |
| 3 weeks or more |
9-9-9-106 |
6.8% |
13.5% |
20.3% |
Runners with two or three career starts have performed well in recent years
Of the 18 Top 3 finishers over the last six years, 17 had “2 or 3” career starts. Up to 2012, runners with “1” or “4 or more” career starts also enjoyed success. However, if trends in recent years are anything to go by, we should focus on runners with “2 or 3” career starts. [Table 5]
[Table 5] Performance by total career starts (last 6 years)
Total career
starts |
Performance
[1st-2nd-3rd-4th or lower] |
Win
ratio |
Top 2
ratio |
Top 3
ratio |
| 1 |
0-0-0-8 |
0% |
0% |
0% |
| 2 or 3 |
6-5-6-47 |
9.4% |
17.2% |
26.6% |
| 4 or more |
0-1-0-35 |
0% |
2.8% |
2.8% |
Seek out the winner!
Do not overlook favoritism in previous race
The last six winners had all been backed as “2nd favorite or higher” in their previous race. When comparing the lead-up races of this year’s runners, we should also check favoritism in their previous races. Other features shared by the six recent winners were that they had no experience of being beaten to 3rd or lower in a “JRA race,” that they had experience of winning a “1,600m+ JRA race,” that the distance of their previous race was 1,400m+, and that they had 2 or 3 career starts. In other words, we should also take into consideration the trends shown in Table 1, 2, 3, and 5. [Table 6]
[Table 6] Winners’ “favoritism in previous race,” lowest finish in “JRA race,” highest finish in “1,600m+ JRA race,” distance of previous race, and total career starts (last 6 years)
| Year |
Winner |
Favoritism
in previous
race |
Lowest finish in
“JRA race” |
Highest finish in
“1,600m+ JRA race” |
Distance of
previous
race |
Total
career
starts |
| 2013 |
Red Reveur |
2nd |
1st (2 starts, 2 wins) |
1st (Sapporo Nisai Stakes, etc.) |
1,800m |
2 |
| 2014 |
Shonan Adela |
1st |
2nd (2yo newcomer) |
1st (2yo maiden) |
1,400m |
3 |
| 2015 |
Major Emblem |
1st |
2nd (Artemis Stakes) |
1st (Aster Sho, etc.) |
1,600m |
3 |
| 2016 |
Soul Stirring |
2nd |
1st (2 starts, 2 wins) |
1st (Ivy Stakes, etc.) |
1,800m |
2 |
| 2017 |
Lucky Lilac |
2nd |
1st (2 starts, 2 wins) |
1st (Artemis Stakes, etc.) |
1,600m |
2 |
| 2018 |
Danon Fantasy |
1st |
2nd (2yo newcomer) |
1st (2yo maiden) |
1,400m |
3 |
(Masaya Ibuki)
|

- Preview
- Barrier draw
- News
- Race result
- Video
- 2025 English

- 2024 English
- 2023 English
- 2022 English
- 2021 English
- 2020 English
- 2019 English
- 2018 English
- 2017 English
- 2016 English
- 2015 English
- 2014 English
- 2013 English
- 2012 English
- Photo Gallery
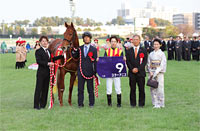
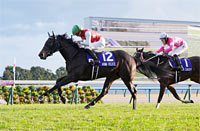
2025 Winner: Star Anise

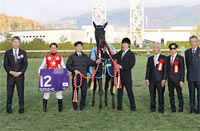
2024 Winner: Arma Veloce
|

")


','../en/racing/news_media/gallery/img/2025/s2/25121402a.jpg','../en/racing/news_media/gallery/img/2025/b/25121402a.jpg'))
','../en/racing/news_media/gallery/img/2025/s2/25121402b.jpg','../en/racing/news_media/gallery/img/2025/b/25121402b.jpg'))
','../en/racing/news_media/gallery/img/2024/s2/24120802a.jpg','../en/racing/news_media/gallery/img/2024/b/24120802a.jpg'))
','../en/racing/news_media/gallery/img/2024/s2/24120802b.jpg','../en/racing/news_media/gallery/img/2024/b/24120802b.jpg'))
