Satsuki Sho (Japanese 2000 Guineas) (G1) - Data Analysis
First leg of the Triple Crown for three-year-olds, which tends to unfold as expected
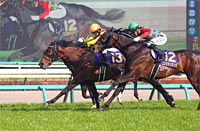
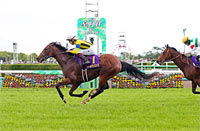
In the 2023 Satsuki Sho (Japanese 2000 Guineas), Sol Oriens triumphed backed by win odds of 5.2 (2nd favorite), Tastiera finished 2nd backed by win odds of 9.0 (5th favorite), and Phantom Thief came in 3rd backed by win odds of 3.8 (1st favorite), resulting in a Trifecta payout of 24,780 yen. Looking back at previous Trifecta payouts in the Satsuki Sho, we observe that the race produced high payouts of 1,064,360 yen in 2017 and 372,080 yen in 2018. However, in the five years since 2019, the Trifecta payouts have consistently dipped below 100,000 yen, averaging roughly 34,000 yen. Incidentally, in the seven races from 2010 to 2016, Trifecta payouts also fell below 100,000 yen, averaging about 32,000 yen. If trends in recent years are anything to go by, therefore, we can assume the race is unlikely to produce major upsets. Let’s now analyze some features shared by successful runners in this race based on results over the last 10 years.
Focus on previous race
Of the 30 Top 3 finishers over the last 10 years, 28 had contested a graded race last time out. Meanwhile, runners coming from a non-graded race struggled with a Top 3 ratio of 4.9%. This suggests we need to discount runners coming from an open-class or allowance-class race. [Table 1]
[Table 1] Performance by previous race (last 10 years)
| Previous race |
Performance
[1st-2nd-3rd-4th or lower] |
Win ratio |
Top 2 ratio |
Top 3 ratio |
| Graded race |
10-9-9-104 |
7.6% |
14.4% |
21.2% |
| Non-graded race |
0-1-1-39 |
0% |
2.4% |
4.9% |
In addition, among the runners that had contested a graded race last time out, those who entered the Satsuki Sho six weeks or more after their previous race achieved an excellent Top 3 ratio of 35.6%. For this year, therefore, we should raise our expectations of runners who previously contested a graded race held in February or earlier. [Table 2]
[Table 2] Among runners that had contested a graded race last time out, performance by interval since previous race (last 10 years)
Interval since
previous race |
Performance
[1st-2nd-3rd-4th or lower] |
Win ratio |
Top 2 ratio |
Top 3 ratio |
| Five weeks or less |
2-6-4-75 |
2.3% |
9.2% |
13.8% |
| Six weeks or more |
8-3-5-29 |
17.8% |
24.4% |
35.6% |
Watch favoritism in previous race
Looking at performances by runners over the last 10 years in terms of favoritism in their previous race, we find that runners that had been backed as top favorites achieved a strong Top 3 ratio of 35.6%. Conversely, runners that had been backed as 7th favorite or lower were all beaten to 4th or lower. When comparing the previous race of the runners, we should concentrate on favoritism. [Table 3]
[Table 3] Performance by favoritism in previous race (last 10 years)
| Favoritism in previous race |
Performance
[1st-2nd-3rd-4th or lower] |
Win ratio |
Top 2 ratio |
Top 3 ratio |
| 1st favorite |
5-6-5-29 |
11.1% |
24.4% |
35.6% |
| 2nd-6th favorite |
5-4-5-86 |
5.0% |
9.0% |
14.0% |
| 7th favorite or lower |
0-0-0-28 |
0% |
0% |
0% |
Runners with experience of finishing in Top 2 of graded race held in Kanto area are leading contenders
Of the 30 Top 3 finishers over the last 10 years, 23 had experience of “finishing in the Top 2 after being positioned 2nd or lower when passing the 4th corner” in a graded race at Tokyo or Nakayama Racecourse. Conversely, runners without such experience struggled with a Top 3 ratio of 6.9%, and their performance in the four years since 2020 was [0-0-0-42]. This means we should be skeptical of runners that have not achieved a Top 2 finish after being positioned 2nd or lower when passing the 4th corner in a graded race held in the Kanto area. [Table 4]
[Table 4] Performance by experience of “finishing in the Top 2 after being positioned 2nd or lower when passing the 4th corner” in a graded race at Tokyo or Nakayama Racecourse (last 10 years)
| Experience |
Performance
[1st-2nd-3rd-4th or lower] |
Win ratio |
Top 2 ratio |
Top 3 ratio |
| Yes |
9-7-7-49 |
12.5% |
22.2% |
31.9% |
| No |
1-3-3-94 |
1.0% |
4.0% |
6.9% |
Runners with “5 or more” career starts have fared poorly in recent years
Of the 18 Top 3 finishers over the last six years, 17 had 4 or fewer career starts. Conversely, runners with 5 or more career starts struggled with a Top 3 ratio of 2.6%. In other words, we should focus on runners with comparatively shorter careers. [Table 5]
[Table 5] Performance by total career starts (last six years)
| Total career starts |
Performance
[1st-2nd-3rd-4th or lower] |
Win ratio |
Top 2 ratio |
Top 3 ratio |
| 4 or fewer |
6-5-6-49 |
9.1% |
16.7% |
25.8% |
| 5 or more |
0-1-0-37 |
0% |
2.6% |
2.6% |
Strong performance by runners that triumphed in previous race
Of the 15 Top 3 finishers in the last five years, 12 finished 1st in their previous race with a time difference of 0.2s or more with the runner-up in that race. Runners in this group achieved an excellent Top 3 ratio of 46.2%. If trends in recent years are anything to go by, we should assume there is a high likelihood that runners that have finished 1st in their previous race with a time difference of 0.2s or more with the runner-up, will chase the top places. [Table 6]
[Table 6] Performance by finish and time difference with runner-up in previous race (last five years)
Finish and time difference with
runner-up in previous race |
Performance
[1st-2nd-3rd-4th or lower] |
Win ratio |
Top 2 ratio |
Top 3 ratio |
1st with time difference of 0.2s or
more with runner-up |
4-5-3-14 |
15.4% |
34.6% |
46.2% |
1st with time difference of 0.1s or
less with runner-up, or 2nd or lower |
1-0-2-59 |
1.6% |
1.6% |
4.8% |
In addition, the three Top 3 finishers that “had finished 1st with a time difference of 0.1s or less with the runner-up, or 2nd or lower in their previous race” had all finished in the Top 5 of Asahi Hai Futurity Stakes. This suggests we should expect little from runners that have either finished 2nd or lower in their previous race or won their previous race without a time difference of 0.2s or more with the runner-up, but finished outside of the Top 5 in the Asahi Hai Futurity Stakes at the end of the previous year. [Table 7]
[Table 7] Among runners that “had finished 1st with a time difference of 0.1s or less with the runner-up, or 2nd or lower in their previous race,” performance by finish in the Asahi Hai Futurity Stakes (last five years)
Finish in the Asahi Hai
Futurity Stakes |
Performance
[1st-2nd-3rd-4th or lower] |
Win ratio |
Top 2 ratio |
Top 3 ratio |
| Top 5 |
1-0-2-5 |
12.5% |
12.5% |
37.5% |
| 6th or lower, or no entry |
0-0-0-54 |
0% |
0% |
0% |
Seek out the winner!
Runners with 3rd or lower finish in previous race have not produced a winner in 15 consecutive years
The last six winners had all finished in the Top 2 of their previous race. The last runner to secure the victory despite finishing 3rd or lower in his previous race was Captain Thule in 2008. Other shared features among the six winners were that they had experience of finishing in the Top 2 of a graded race at Tokyo or Nakayama Racecourse, and that they had 4 or fewer careers starts. This suggests we should also take into consideration the trends shown in Tables 4 and 5. [Table 8]
[Table 8] Winners’ finish in previous race, highest finish in graded race at Tokyo or Nakayama Racecourse, and career starts (last six years)
| Year |
Winner |
Finish in
previous race |
Highest finish in graded race at
Tokyo or Nakayama Racecourse |
Career
starts |
| 2018 |
Epoca d’Oro |
2nd |
2nd (Spring Stakes) |
4 |
| 2019 |
Saturnalia |
1st |
1st (Hopeful Stakes) |
3 |
| 2020 |
Contrail |
1st |
1st (Hopeful Stakes, etc.) |
3 |
| 2021 |
Efforia |
1st |
1st (Kyodo News Hai [Tokinominoru Kinen]) |
3 |
| 2022 |
Geoglyph |
2nd |
2nd (Kyodo News Hai [Tokinominoru Kinen]) |
4 |
| 2023 |
Sol Oriens |
1st |
1st (Keisei Hai) |
2 |
(Masaya Ibuki)
|


