2015 News
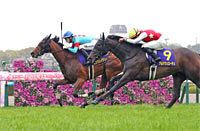
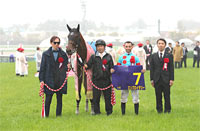
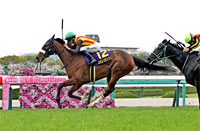
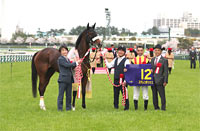
Data Analysis for the “2015 Oka Sho (Japanese 1000 Guineas) (G1)”Legendary greats show their mettle in this classic opener for fillies Inaugurated in 1939 and held for the 75th time this year, the Oka Sho is a G1 race for 3-year-old fillies that was modeled on the UK classic “1000 Guineas”. A list of winners in recent years is like a roll call of famous contenders that have gone beyond the filly and mare category to achieve major racing success – like Daiwa Scarlet (2007), winner of the 2008 Arima Kinen (the Grand Prix); Buena Vista (2009), voted Horse of the Year in the 2010 JRA Awards; and Gentildonna (2012), first ever back-to-back winner of the Japan Cup. So which filly’s name will be etched in racing annals as winner of this tradition-steeped race, going on to rub shoulders with the greatest fillies in Japanese racing history? This time, let’s analyze some points shared by successful runners in this race from results over the last 10 years (including the years up to 2006, before the course at Hanshin was renovated). Tulip Sho favored as the previous race Of 30 top 3 finishers over the last 10 years, 13 had most recently contested the “Tulip Sho”. Fillies in this group have marked excellent success ratios, with a top 3 ratio of 31.7%. Meanwhile, runners last seen in the “Flower Cup”, “Elfin Stakes”, “Queen Cup” and “Hanshin Juvenile Fillies” have also achieved relatively good success ratios, albeit some of them are from a smaller pool of entrants. Horses faring less impressively are those coming straight from the “Fillies’ Revue” (top 3 ratio 7.3%) and “Anemone Stakes” (top 3 ratio 4.2%). Like the Tulip Sho, these two are also Oka Sho trials, yet fail to inspire any confidence as preparation for this race. [Table 1] [Table 1] Performance by previous race (last 10 years)
Look for a good track record in 1,600m+ turf races Let’s now check the runners’ aggregate performances by their highest finish in a JRA open class race on turf run over 1,600m or more. Of 30 top 3 finishers over the last 10 years, 21 had previously won a JRA open class race on turf run over 1,600m or more. Horses in this group also have good success ratios, with a top 3 ratio of 33.3%. By contrast, success has not smiled on horses with no experience of entering these races, or with best finish of 8th or lower. Fillies with a track record only in turf races run over less than 1,600m or dirt races seem to struggle in this one. [Table 2] [Table 2] Performance by highest finish in a JRA open class on 1,600m+ turf race (last 10 years)
Strong showing by horses with shorter careers Of 30 top 3 finishers over the last 10 years, 15 had come to this race with “4 or fewer” previous career starts. Although 15 runners with “5 or more” starts have similarly finished in the top 3, their success ratios are significantly inferior to those with “4 or fewer” starts. When comparing past racing records, it might be worth focusing on horses with shorter racing careers. [Table 3] [Table 3] Performance by total career starts (last 10 years)
Incidentally, 9 of the 15 top 3 finishers with “5 or more” total career starts had achieved a “top 6” finish in the previous year’s Hanshin Juvenile Fillies. In terms of success ratios, too, those with “top 6” finishes have fared far better than those finishing “7th or lower” and those that “did not run”. Horses with 5 or more career starts could be judged on their performance in the previous year’s 2-year-old champion filly decider. [Table 4] [Table 4] Performance of runners with ”5 or more” career starts by finish in the Hanshin Juvenile Fillies (last 10 years)
Discount runners in brackets 1-3 An interesting statistic emerges if we check out performances by bracket number since 2007, when Hanshin Racecourse was reopened after refurbishment and the race was first held on the new 1,600m turf outer course. Specifically, not one horse starting in brackets “1-3” has finished in the top 2, and only one has come home in 3rd (Katamachi Botan in 2007, bracket 2 number 3). Our attention should be on runners in the middle to outer brackets – not so much the inner ones. [Table 5] [Table 5] Performance by bracket number (last 8 years)
Pacesetters in a slump recently Since 2007, when the race was first held on the 1,600m turf outer course, fillies most recently appearing in a JRA race in which they passed the 4th corner in “1st or 2nd” position have struggled to impress in this race, with a top 3 ratio of only 6.1%. [Table 6] [Table 6] Performance of runners previously appearing in a JRA race, by their position at the 4th corner in that race (last 8 years)
On a similar note, horses with experience of a top 2 finish in a JRA race after passing the 4th corner in 1st or 2nd position have poorer success ratios than those without such experience, having achieved a top 3 ratio of only 10.5% since 2007. We should not expect too much of horses that led the pack in their previous race, or have experienced a top 2 finish by adopting such a strategy. [Table 7] [Table 7] Performance by experience of a top 2 finish in a JRA race after passing the 4th corner in 1st or 2nd position (last 8 years)
Seek out the winners! All six winners over the last 6 years had experienced a top 2 finish in a JRA open class on 1,600m turf race. Other features shared by these six are that their total career starts were “5 or fewer”, their bracket number was “4-8”, and they passed the 4th corner in “3rd or lower position” in their previous race. Incidentally, last year there were five runners that met all of these conditions, and four of them occupied the first 4 places. [Table 8] [Table 8] Winners' highest finish in JRA open class on 1,600m turf races, total career starts, bracket number, and position at 4th corner in previous race (last 6 years)
(Data analysis by Masaya Ibuki) |

|


