NHK Mile Cup (G1) - Data Analysis
No lack of surprises in 3-year-old mile champion decider
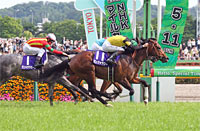
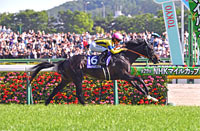
Last year’s NHK Mile Cup was won by 6th favorite Keiai Nautique with win odds of 12.8, resulting in a considerable Trifecta payout of 129,560 yen. Looking back at previous Trifecta payouts, we observe that in the 14 years since 2005 (when Trifecta bets were introduced), the race has produced nine payouts of over 100,000 yen, three of which were massive at over 1,000,0000 yen. In addition, of the 69 Top 3 finishers in the 23 years since the race was launched, 22 runners (roughly one-third) entered the race backed by win odds of over 20-1, suggesting poorly favored runners should not be underestimated. Let’s now analyze some features shared by successful runners in this race based on results over the last 10 years.
Check distance, finish, and time difference in previous race
Looking at performances by runners over the last 10 years in terms of the distance of their previous race, we observe that runners that had contested a race of “above 1,600m” last time out achieved a comparatively strong Top 3 ratio of 30.2%. In other words, we should raise our expectations of runners that contested a longer race than the NHK Mile Cup in their previous outing. [Table 1]
[Table 1] Performance by distance of previous race (last 10 years)
| Distance of previous race |
Performance
[1st-2nd-3rd-4th or lower] |
Win ratio |
Top 2 ratio |
Top 3 ratio |
| Below 1,600m |
0-2-1-40 |
0% |
4.7% |
7.0% |
| 1,600m |
8-2-4-80 |
8.5% |
10.6% |
14.9% |
| Above 1,600m |
2-6-5-30 |
4.7% |
18.6% |
30.2% |
Meanwhile, among runners that had contested a race “below 1,600m” last time out, those that finished “2nd or lower” in that race were all beaten to 4th or lower [Table 2]
[Table 2] Among runners that had contested a race “below 1,600m” in their previous race, performance by finish in that race (last 10 years)
| Finish in previous race |
Performance
[1st-2nd-3rd-4th or lower] |
Win ratio |
Top 2 ratio |
Top 3 ratio |
| 1st |
0-2-1-20 |
0% |
8.7% |
13.0% |
| 2nd or lower |
0-0-0-20 |
0% |
0% |
0% |
In addition, among runners that had contested a “1,600m race” last time out, those that finished 2nd or lower in that race and had a time difference of 0.6s or higher with the winner in that race, were also all beaten to 4th or lower in the NHK Mile Cup. When comparing runners that contested a race of 1,600m or less in their previous outing, we should carefully take into consideration their finish and time difference with the winner in that race. [Table 3]
[Table 3] Among runners that had contested a “1,600m” race in their previous race, performance by finish and time difference with winner in that race (last 10 years)
Finish and time difference with
winner in previous race |
Performance
[1st-2nd-3rd-4th or lower] |
Win ratio |
Top 2 ratio |
Top 3 ratio |
1st, or time difference with
winner of 0.5s or less |
8-2-4-48 |
12.9% |
16.1% |
22.6% |
2nd or lower, and time difference
with winner of 0.6s or more |
0-0-0-32 |
0% |
0% |
0% |
Runners that have enjoyed success at Nakayama & Hanshin Racecourses are strong performers
Of the 30 Top 3 finishers over the last 10 years, 26 had experience of finishing in the Top 4 of a “1,600m+ open-class race held at either Nakayama or Hanshin Racecourse.” Conversely, runners without such experience have struggled with a Top 3 ratio of 5.3%. Although the NHK Mile Cup is a turf 1,600m race held at Tokyo Racecourse, we should focus on runners that have enjoyed success in a 1,600m+ open-class race held at either Nakayama or Hanshin Racecourse. [Table 4]
[Table 4] Performance by experience of finishing in Top 4 of “1,600m+ open-class race held at either Nakayama or Hanshin Racecourse” (last 10 years)
| Experience |
Performance
[1st-2nd-3rd-4th or lower] |
Win ratio |
Top 2 ratio |
Top 3 ratio |
| Yes |
10-9-7-79 |
9.5% |
18.1% |
24.8% |
| No |
0-1-3-71 |
0% |
1.3% |
5.3% |
Runners with seven or more career starts struggle
Of the 30 Top 3 finishers over the last 10 years, 22 had “6 or less” career starts. Conversely, runners with “7 or more” career starts have struggled with a Top 3 ratio of 9.4%. This suggests we should lower our expectations of runners with longer careers. [Table 5]
[Table 5] Performance by total career starts (last 10 years)
| Total career starts |
Performance
[1st-2nd-3rd-4th or lower] |
Win ratio |
Top 2 ratio |
Top 3 ratio |
| 6 or less |
7-8-7-73 |
7.4% |
15.8% |
23.2% |
| 7 or more |
3-2-3-77 |
3.5% |
5.9% |
9.4% |
Front runners have fared well in recent years
Of the 18 Top 3 finishers over the last six years, 9 had experience of winning a “race at one of the four major JRA racecourses (Tokyo, Nakayama, Kyoto, Hanshin) in which they were positioned 1st-2nd when passing the 4th corner.” Conversely, runners without such experience struggled somewhat with a Top 3 ratio of 12.3%. Although runners in the latter group produced many strong performers until 2012, runners that have been successful in a race at one of the four major JRA venues in which they were positioned 1st-2nd when passing the 4th corner have had the edge in recent years. [Table 6]
[Table 6] Performance by experience of winning a “race at one of the four major JRA racecourses in which they were positioned 1st-2nd when passing the 4th corner” (last 6 years)
| Winning experience |
Performance
[1st-2nd-3rd-4th or lower] |
Win ratio |
Top 2 ratio |
Top 3 ratio |
| Yes |
4-3-2-26 |
11.4% |
20.0% |
25.7% |
| No |
2-3-4-64 |
2.7% |
6.8% |
12.3% |
In addition, among runners without the abovementioned experience, those that were positioned “8th or lower” when passing the 4th corner in their previous race have produced zero Top 2 finishers, and had a Top 3 ratio of only 4.9%. In other words, runners that have not won at one of the four major JRA venues in which they were positioned 1st-2nd when passing the 4th corner and that occupied the middle or back of the field in their last outing are likely to struggle. [Table 7]
[Table 7] Among runners without experience of winning a “race at one of the four major JRA racecourses in which they were positioned 1st-2nd when passing the 4th corner,” performance by position when passing the 4th corner in previous race (last 6 years)
Position at 4th corner
in previous race |
Performance
[1st-2nd-3rd-4th or lower] |
Win ratio |
Top 2 ratio |
Top 3 ratio |
| 7th or higher |
2-3-2-25 |
6.3% |
15.6% |
21.9% |
| 8th or lower |
0-0-2-39 |
0% |
0% |
4.9% |
Seek out the winner!
Runners with previous success in major races are leading contenders
The last four winners all had experience of finishing in the Top 5 of a “JRA G1 race.” We should therefore closely watch runners that have already enjoyed success in major races. Other shared features among the four winners were the fact that they had contested a 1,600m+ race in their previous race, that they finished in the Top 5 of that race, and that they had experience of finishing in the Top 3 of a “1,600m+ open-class race held at either Nakayama or Hanshin Racecourse.” In other words, we should focus on the trends shown in Table 1 to Table 4. [Table 8]
[Table 8] Last four winners’ “highest finish in ‘JRA G1 race,’” “distance of previous race,” “finish in previous race,” “highest finish in 1,600m+ open-class race held at either Nakayama or Hanshin Racecourse”
| Year |
Winner |
Highest finish in
JRA G1 race |
Distance of
previous race |
Finish in
previous race |
Highest finish in 1,600m+ open-class
race at Nakayama or Hanshin RC |
| 2015 |
Clarity Sky |
3rd (2014 Asahi Hai
Futurity Stakes) |
2,000m |
5th |
3rd (2014 Asahi Hai Futurity Stakes) |
| 2016 |
Major Emblem |
1st (2015 Hanshin
Juvenile Fillies) |
1,600m |
4th |
1st (2015 Hanshin Juvenile Fillies) |
| 2017 |
Aerolithe |
5th (2017 Oka Sho) |
1,600m |
5th |
2nd (2017 Fairy Stakes) |
| 2018 |
Keiai Nautique |
4th (2017 Asahi Hai
Futurity Stakes) |
1,600m |
2nd |
2nd (2018 New Zealand Trophy) |
(Masaya Ibuki)
|

- Preview
- Barrier draw
- Past performances of runners

- News
- Race result
- Video
- 2025 English

- 2024 English

- 2023 English

- 2022 English

- 2021 English

- 2020 English

- 2019 English

- 2018 English

- 2017 English

- 2016 English

- 2015 English

- 2014 English

- 2013 English

- Photo Gallery
2025 Winner: Panja Tower


2024 Winner: Jantar Mantar


|


