Champions Cup (G1) - Data Analysis
Ultimate contest for leading dirt horses
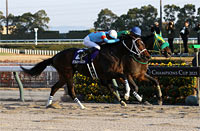
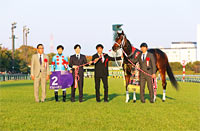
After winning the 2018 Champions Cup, and thereby extending his winning streak in G1/top-level dirt races to four, Le Vent Se Leve won the title of Best Dirt Horse in the JRA Awards of the same year. Of the 19 runners that have been awarded that title since 2000, 14 had achieved a victory in the Champions Cup (which was held under the name “Japan Cup Dirt” up to 2013). True to its name, this race determines the dirt champion of Japanese horseracing. This year again, the big question is whether runners with a record of success in major dirt races will deliver the goods, or whether a dark horse will take us all by surprise and snatch the spoils. Let’s now analyze some features shared by successful runners in this race based on results over the last 10 years.
Watch performance since turn of the year
Of the 30 Top 3 finishers in the last 10 years, 21 had experience of finishing in the Top 2 of “a graded race held in the same year at one of the four big racecourses (Tokyo, Nakayama, Kyoto, or Hanshin).” Conversely, runners without such experience struggled somewhat with a Top 3 ratio of 10.5%. In other words, we should lower our expectations of runners that have mainly appeared in races at local racecourses (Sapporo, Hakodate, Fukushima, Niigata, Chukyo, and Kokura), open-class stakes or allowance-class races, or local dirt races, and have not achieved a Top 2 finish in a race at one of the four big racecourses. [Table 1]
[Table 1] Performance by experience of finishing in the Top 2 of “a graded race held in the same year at one of the four big racecourses (Tokyo, Nakayama, Kyoto, or Hanshin)” (last 10 years)
| Top 2 finish experience |
Performance
[1st-2nd-3rd-4th or lower] |
Win ratio |
Top 2 ratio |
Top 3 ratio |
| Yes |
8-8-5-50 |
11.3% |
22.5% |
29.6% |
| No |
2-2-5-77 |
2.3% |
4.7% |
10.5% |
Furthermore, among runners without experience of finishing in the Top 2 of “a graded race held in the same year at one of the four big racecourses,” those that had finished “4th or lower” in their previous race were all beaten to 4th or lower. [Table 2]
[Table 2] Among runners without experience of finishing in the Top 2 of “a graded race held in the same year at one of the four big racecourses (Tokyo, Nakayama, Kyoto, or Hanshin),” performance by finish in the previous race (last 10 years)
| Finish in previous race |
Performance
[1st-2nd-3rd-4th or lower] |
Win ratio |
Top 2 ratio |
Top 3 ratio |
| Top 3 |
2-2-5-35 |
4.5% |
9.1% |
20.5% |
| 4th or lower |
0-0-0-42 |
0% |
0% |
0% |
In addition, among runners without experience of finishing in the Top 2 of “a graded race held in the same year at one of the four big racecourses,” those that had contested a “non-JBC race” in their previous race struggled with a Top 3 ratio of 4.2%. Among runners with no experience of finishing in the Top 2 of “a graded race held in the same year at one of the four big racecourses,” we should focus on runners that finished in the “Top 3” in their previous race and runners that had contested a “JBC race” in their previous race. [Table 3]
[Table 3] Among runners without experience of finishing in the Top 2 of “a graded race held in the same year at one of the four big racecourses (Tokyo, Nakayama, Kyoto, or Hanshin),” performance by previous race (last 10 years)
| Previous race |
Performance
[1st-2nd-3rd-4th or lower] |
Win ratio |
Top 2 ratio |
Top 3 ratio |
| JBC race |
2-2-3-31 |
5.3% |
10.5% |
18.4% |
Non-
JBC race |
0-0-2-46 |
0% |
0% |
4.2% |
Number of career starts is key
Of the 30 Top 3 finishers in the last 10 years, 24 had “27 or fewer” career starts. Conversely, runners with “28 or more” career starts struggled somewhat with a Top 3 ratio of 11.5%. In other words, we should lower our expectations of runners with longer careers. [Table 4]
[Table 4] Performance by career starts (past 10 years)
| Career starts |
Performance
[1st-2nd-3rd-4th or lower] |
Win ratio |
Top 2 ratio |
Top 3 ratio |
| 27 or fewer |
9-8-7-81 |
8.6% |
16.2% |
22.9% |
| 28 or more |
1-2-3-46 |
1.9% |
5.8% |
11.5% |
Furthermore, among the runners with “28 or more” career starts, those that had finished “4th or lower” in their previous race were all beaten to 4th or lower. [Table 5]
[Table 5] Among runners with “28 or more” career starts, performance by finish in the previous race (last 10 years)
| Finish in previous race |
Performance
[1st-2nd-3rd-4th or lower] |
Win ratio |
Top 2 ratio |
Top 3 ratio |
| Top 3 |
1-2-3-20 |
3.8% |
11.5% |
23.1% |
| 4th or lower |
0-0-0-26 |
0% |
0% |
0% |
In addition, among the runners with “28 or more” career starts, those that had contested a “non-JBC race” in their previous race were all beaten to 4th or lower. In other words, with the exception of runners that have contested a “JBC race” in their previous race and finished in the Top 3 of that, runners with “28 or more” career starts are unlikely to be chasing the top places. [Table 6]
[Table 6] Among runners with “28 or more” career starts, performance by previous race (last 10 years)
| Previous race |
Performance
[1st-2nd-3rd-4th or lower] |
Win ratio |
Top 2 ratio |
Top 3 ratio |
| JBC race |
1-2-3-20 |
3.8% |
11.5% |
23.1% |
| Non-JBC race |
0-0-0-26 |
0% |
0% |
0% |
Focus on runners that were highly favored in previous race
Of the 30 Top 3 finishers in the last 10 years, 28 had contested a “domestic race” in their previous race backed as “5th favorite or higher.” Conversely, runners that were backed as “6th favorite or lower” struggled with a Top 3 ratio of 5.3%, and in the eight years from 2011 delivered performance of [0-0-0-28] (Top 3 ratio of 0%). When comparing the details of the previous race, we need to focus on favoritism in that race. [Table 7]
[Table 7] Among runners that contested a “domestic race” in their previous race, performance by favoritism in that race (last 10 years)
Favoritism in
previous race |
Performance
[1st-2nd-3rd-4th or lower] |
Win ratio |
Top 2 ratio |
Top 3 ratio |
| 5th favorite or higher |
10-9-9-85 |
8.8% |
16.8% |
24.8% |
| 6th favorite or lower |
0-1-1-36 |
0% |
2.6% |
5.3% |
Runners starting out in the outer brackets have struggled in recent years
Of the 15 Top 3 finishers in this 1,800m dirt race held at the Chukyo Racecourse over the last five years, 12 entered the race with the numbers “1-9.” Conversely, runners with the numbers “10-16” struggled with a Top 3 ratio of 9.4%. This suggests we should lower our expectations of runners starting out in the outer brackets. [Table 8]
[Table 8] Performance by horse number (last 5 years)
| Horse number |
Performance
[1st-2nd-3rd-4th or lower] |
Win ratio |
Top 2 ratio |
Top 3 ratio |
| 1-9 |
5-3-4-33 |
11.1% |
17.8% |
26.7% |
| 10-16 |
0-2-1-29 |
0% |
6.3% |
9.4% |
Runners that occupied the back of the field in their previous race struggle
Of the 15 Top 3 finishers in this 1,800m dirt race held at the Chukyo Racecourse over the last five years, 13 contested a “domestic race” in their previous race in which they were ranked “7th or higher” when passing the 4th corner. Meanwhile, runners that were ranked “8th or lower” when passing the 4th corner in such a race struggled with a Top 3 ratio of 7.7%. When comparing the details of the previous race, we should check the position of runners throughout the race. [Table 9]
[Table 9] Among runners that contested “a domestic race” in their previous race, performance by position when passing 4th corner in that race (last 5 years)
Position when passing
4th corner in previous race |
Performance
[1st-2nd-3rd-4th or lower] |
Win ratio |
Top 2 ratio |
Top 3 ratio |
| 7th or higher |
4-4-5-34 |
8.5% |
17.0% |
27.7% |
| 8th or lower |
1-1-0-24 |
3.8% |
7.7% |
7.7% |
Seek out the winner!
Focus on runners coming straight from a major race
The last five winners all had contested a top-level dirt race in their previous race. This suggests we should lower our expectations of runners that have contested a race other than a G1 or top-level dirt race in their previous race. Other features shared by the five winners were that they had all been backed as “5th favorite or higher” in their previous race, and that they entered the Champions Cup with the numbers “1-9”. In other words, we should also take into account various other trends, including those shown in Table 8 and Table 9. [Table 10]
[Table 10] Winners’ “horse number,” “previous race,” and “favoritism in previous race” (last 5 years)
| Year |
Winner |
Horse
number |
Previous race |
Favoritism in
previous race |
| 2014 |
Hokko Tarumae |
8 |
JBC Classic (top-level dirt race) |
4th favorite |
| 2015 |
Sambista |
4 |
JBC Ladies’ Classic (top-level dirt race) |
1st favorite |
| 2016 |
Sound True |
8 |
JBC Classic (top-level dirt race) |
5th favorite |
| 2017 |
Gold Dream |
9 |
Mile Championship Nambu Hai (top-level dirt race) |
2nd favorite |
| 2018 |
Le Vent Se Leve |
2 |
Mile Championship Nambu Hai (top-level dirt race) |
2nd favorite |
(Masaya Ibuki)
|


