Victoria Mile (G1) - Data Analysis
Note: “1-win,” “2-win,” and “3-win” classes correspond to the previous “5 million yen-or-less,” “10 million yen-or-less,” and “16 million yen-or-less” classes
Spring queen decider in which runners with no previous G1 victories have performed well in recent years
The Victoria Mile is a major spring race for many fillies and mares aged 4 and above. In its early days, the race was won by a string of runners that had previously notched victories in classic races, including Dance in the Mood (winner of the first Victoria Mile), Vodka, Buena Vista, and Apapane. However, if we turn our attention to recent years, we find that four out of the five winners since 2015 entered the race with no previous G1 victories and were not highly favored in the race (backed as 5th favorite or lower). Let’s now look for some trends in this race, which has been dominated by dark horses in recent years, based on results over the last 10 years.
Focus on 4-year-olds
Looking at performances by runners over the last 10 years in terms of age, we observe 4-year-olds made up the largest age group and achieved the highest Top 2 and Top 3 ratios. [Table 1]
[Table 1] Performance by age (10 years)
| Age |
Performance
[1st-2nd-3rd-4th or lower] |
Win ratio |
Top 2 ratio |
Top 3 ratio |
| 4 |
6-7-3-68 |
7.1% |
15.5% |
19.0% |
| 5 |
2-2-5-48 |
3.5% |
7.0% |
15.8% |
| 6 |
1-1-2-26 |
3.3% |
6.7% |
13.3% |
| 7 |
1-0-0-6 |
14.3% |
14.3% |
14.3% |
Among 4-year-olds, runners that had previously finished in the Top 5 of a G1 race exhibited strong performance, producing all six winners. [Table 2]
[Table 2] Among 4-year-olds, performance by experience of finishing in Top 5 of G1 race (last 10 years)
| Experience |
Performance
[1st-2nd-3rd-4th or lower] |
Win ratio |
Top 2 ratio |
Top 3 ratio |
| Yes |
6-4-2-42 |
11.1% |
18.5% |
22.2% |
| No |
0-3-1-26 |
0% |
10.0% |
13.3% |
Looking at performances by runners aged 5 and above by finish in the year-earlier Victoria Mile, we find that the seven Top 2 finishers in this age group had entered the year-earlier Victoria Mile and six had finished in the Top 3 of that race. We also note that the runners that had finished in the Top 3 of the year-earlier Victoria Mile achieved a high Top 2 ratio. [Table 3]
[Table 3] Among runners aged 5 and above, performance by finish in year-earlier Victoria Mile (10 years)
Finish in year-earlier
Victoria Mile |
Performance
[1st-2nd-3rd-4th or lower] |
Win ratio |
Top 2 ratio |
Top 3 ratio |
| Top 3 |
4-2-0-9 |
26.7% |
40.0% |
40.0% |
| 4th or lower |
0-1-2-28 |
0% |
3.2% |
9.7% |
| Did not enter race |
0-0-5-43 |
0% |
0% |
10.4% |
Runners starting in inner brackets and backed as 5th to 8th favorite have fared well in recent years
Looking at performances by runners over the last 10 years in terms of bracket number, we do not find a large difference in success ratios between runners starting in brackets “1-4” and those starting in brackets “5-8.” [Table 4]
[Table 4] Performance by bracket number (last 10 years)
| Bracket number |
Performance
[1st-2nd-3rd-4th or lower] |
Win ratio |
Top 2 ratio |
Top 3 ratio |
| 1-4 |
4-4-7-65 |
5.0% |
10.0% |
18.8% |
| 5-8 |
6-6-3-83 |
6.1% |
12.2% |
15.3% |
Looking at performances by runners starting in brackets “1-4” in terms of favoritism, the strong performance by runners backed as “5th-8th favorite” jumps out. Four of the five winners since 2015 fell into this category. In other words, we should take another look at runners with this kind of record this year. [Table 5]
[Table 5] Among runners starting in brackets “1-4,” performance by favoritism (last 10 years)
| Favoritism |
Performance
[1st-2nd-3rd-4th or lower] |
Win ratio |
Top 2 ratio |
Top 3 ratio |
| 1st-4th favorite |
0-1-2-17 |
0% |
5.0% |
15.0% |
| 5th-8th favorite |
4-1-4-11 |
20.0% |
25.0% |
45.0% |
| 9th favorite or lower |
0-2-1-37 |
0% |
5.0% |
7.5% |
Looking at performances by runners starting in brackets “5-8” in terms of favoritism, we find that runners backed as “1st-4th favorite” achieved a high Top 3 ratio. Although we should also take a look at runners with this kind of record, we need to go back as far as 2013 to find a winner in this group (Verxina). [Table 6]
[Table 6] Among runners starting in brackets “5-8,” performance by favoritism (last 10 years)
| Favoritism |
Performance
[1st-2nd-3rd-4th or lower] |
Win ratio |
Top 2 ratio |
Top 3 ratio |
| 1st-4th favorite |
4-4-1-11 |
20.0% |
40.0% |
45.0% |
| 5th-8th favorite |
1-1-0-18 |
5.0% |
10.0% |
10.0% |
| 9th favorite or lower |
1-1-2-54 |
1.7% |
3.4% |
6.9% |
Watch finish of runners that have contested 1,600m race last time out
Looking at performances by runners over the last 10 years in terms of distance of their previous race, we find that runners that had contested a “1,900m+” race last time out achieved the highest Win, Top 2, and Top 3 ratios. However, runners that had contested a “1,600m” race last time out produced the largest number of Top 3 finishers (11), and achieved the second-highest success ratios behind the “1,900m+” group. However, looking at performances by runners that had finished “6th or lower” in their previous race in terms of distance of that race, we note that runners that had contested a “1,600m” race last time out had a Top 3 ratio of 3.7% and much lower success ratios across the board. The only Top 3 finisher that had “contested a 1,600m race last time out and finished 6th or lower in that race,” was Straight Girl, winner of two consecutive years, in 2016.
In addition, of the 39 runners that had contested a “1,400m” race last time out, 36 (including four Top 3 finishers) had previously contested the Hanshin Himba Stakes. However, the Hanshin Himba Stakes is currently held as a 1,600m race, so performance in a “1,400m race” last time out should probably be used as reference data only. [Table 7] [Table 8]
[Table 7] Performance by distance of previous race (last 10 years)
Distance of
previous race |
Performance
[1st-2nd-3rd-4th or lower] |
Win ratio |
Top 2 ratio |
Top 3 ratio |
| 1,200m |
1-0-1-14 |
6.3% |
6.3% |
12.5% |
| 1,400m |
1-2-1-35 |
2.6% |
7.7% |
10.3% |
| 1,600m |
4-4-3-44 |
7.3% |
14.5% |
20.0% |
| 1,800m |
2-2-4-43 |
3.9% |
7.8% |
15.7% |
| 1,900m+ |
2-2-1-12 |
11.8% |
23.5% |
29.4% |
[Table 8] Among runners that had finished “6th or lower in previous race,” performance by distance of previous race (last 10 years)
Distance of
previous race |
Performance
[1st-2nd-3rd-4th or lower] |
Win ratio |
Top 2 ratio |
Top 3 ratio |
| 1,200m |
1-0-0-11 |
8.3% |
8.3% |
8.3% |
| 1,400m |
1-2-0-15 |
5.6% |
16.7% |
16.7% |
| 1,600m |
1-0-0-26 |
3.7% |
3.7% |
3.7% |
| 1,800m |
1-1-0-14 |
6.3% |
12.5% |
12.5% |
| 1,900m+ |
1-2-0-8 |
9.1% |
27.3% |
27.3% |
Lackluster performance by runners that have contested three or more races since start of the year
Looking at performances by runners over the last 10 years in terms of the number of races contested between the start of the year and the Victoria Mile, we observe that half of the Top 3 finishers had contested “1” race since the start of the year, and 12 Top 3 finishers had contested “2” races since the start of the year. However, the number of Top 3 finishers dropped to three for runners that had contested “3” races since the start of the year. Although 2017 winner Admire Lead had contested “3” races since the start of the year (10 million yen-or-less [currently 2-win] class, 16 million yen-or-less [currently 3-win] class, and Hanshin Himba Stakes), she had only contested one open-class race during this period. Runners that had contested “3 or more” open-class races since the start of the year struggled with performance of [0-0-1-27]. This may be attributable in part to a demanding racing schedule. [Table 9]
[Table 9] Performance by number of races contested since the start of the year (last 10 years)
Number of
races contested |
Performance
[1st-2nd-3rd-4th or lower] |
Win ratio |
Top 2 ratio |
Top 3 ratio |
| 0 |
0-0-0-4 |
0% |
0% |
0% |
| 1 |
6-5-4-38 |
11.3% |
20.8% |
28.3% |
| 2 |
3-5-4-62 |
4.1% |
10.8% |
16.2% |
| 3 |
1-0-2-33 |
2.8% |
2.8% |
8.3% |
| 4 or more |
0-0-0-11 |
0% |
0% |
0% |
Seek out the winner!
Watch runners that have enjoyed success in a turf 1,600m G1 race
The last 10 winners all had a Top 3 ratio of 50% or higher in previous 1,600m races. In addition, five out of the six 4-year-old winners had finished in the Top 5 of the Oka Sho (Japanese 1000 Guineas), and the four winners aged 5 or above had finished in the Top 3 of the year-earlier Victoria Mile. In other words, we should raise our expectations of runners that have enjoyed success in a turf 1,600m G1 race for fillies and mares held in the previous year. [Table 10]
[Table 10] Winners’ performance in turf 1,600m races prior to the Victoria Mile (last 10 years)
| Year |
Winner |
Age |
Performance
[1st-2nd-3rd-4th
or lower] |
Top 3
ratio |
Favorable finish in year-earlier
1,600m G1 race |
| 2010 |
Buena Vista |
4 |
4-0-0-0 |
100% |
Oka Sho (Japanese 1000 Guineas), 1st |
| 2011 |
Apapane |
4 |
4-1-0-1 |
83.3% |
Oka Sho (Japanese 1000 Guineas), 1st |
| 2012 |
Whale Capture |
4 |
2-2-0-0 |
100% |
Oka Sho (Japanese 1000 Guineas), 2nd |
| 2013 |
Verxina |
4 |
1-1-0-0 |
100% |
Oka Sho (Japanese 1000 Guineas), 2nd |
| 2014 |
Verxina |
5 |
2-1-0-2 |
60.0% |
Victoria Mile, 1st |
| 2015 |
Straight Girl |
6 |
0-0-1-1 |
50.0% |
Victoria Mile, 3rd |
| 2016 |
Straight Girl |
7 |
1-0-1-2 |
50.0% |
Victoria Mile, 1st |
| 2017 |
Admire Lead |
4 |
2-1-0-3 |
50.0% |
Oka Sho (Japanese 1000 Guineas), 5th |
| 2018 |
Jour Polaire |
5 |
4-1-2-2 |
77.8% |
Victoria Mile, 3rd |
| 2019 |
Normcore |
4 |
1-0-0-0 |
100% |
N/A |
(Maya Takanami)
|

- Preview
- Barrier draw
- Past performances of runners

- News
- Race result
- Video
- 2026 English

- 2025 English
- 2024 English
- 2023 English
- 2022 English
- 2021 English
- 2020 English
- 2019 English
- 2018 English
- 2017 English
- 2016 English
- 2015 English
- 2014 English
- 2013 English
- Photo Gallery
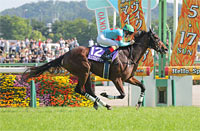
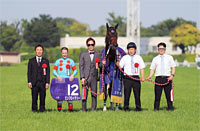
2026 Winner: Embroidery
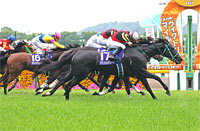
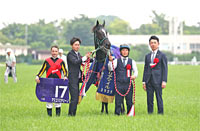
2025 Winner: Ascoli Piceno
|

")


','../en/racing/news_media/gallery/img/2026/s2/260517a.jpg','../en/racing/news_media/gallery/img/2026/b/260517a.jpg'))
','../en/racing/news_media/gallery/img/2026/s2/260517b.jpg','../en/racing/news_media/gallery/img/2026/b/260517b.jpg'))
','../en/racing/news_media/gallery/img/2025/s2/250518a.jpg','../en/racing/news_media/gallery/img/2025/b/250518a.jpg'))
','../en/racing/news_media/gallery/img/2025/s2/250518b.jpg','../en/racing/news_media/gallery/img/2025/b/250518b.jpg'))
