Yasuda Kinen (G1) - Data Analysis
Pulsating spring mile champion decider
The Yasuda Kinen is a turf 1,600m race held at Tokyo Racecourse that is regarded as the mile champion decider of the spring season. Winners of recent years have included runners that have achieved global fame such as Real Impact, Lord Kanaloa, Just a Way, and Maurice. Let’s now analyze the trends in this top attraction of the spring season based on results over the last 10 years.
Runners backed as 6th to 9th favorite have produced five winners over last 10 years
Looking at performances by runners over the last 10 years in terms of their favoritism, we find that runners backed as “1st favorite” have achieved the highest Top 3 ratio at 60.0%, followed by runners backed as “3rd favorite” at 50.0%. At the same time, we note that runners backed as “6th-9th favorite” have produced five winners. This means we need to sufficiently bear in mind the possibility that a poorly favored horse will take the crown. [Table 1]
[Table 1] Performance by favoritism (last 10 years)
| Favoritism |
Performance
[1st-2nd-3rd-4th or lower] |
Win ratio |
Top 2 ratio |
Top 3 ratio |
| 1st favorite |
3-1-2-4 |
30.0% |
40.0% |
60.0% |
| favorite |
1-0-0-9 |
10.0% |
10.0% |
10.0% |
| favorite |
0-3-2-5 |
0% |
30.0% |
50.0% |
| favorite |
1-0-0-9 |
10.0% |
10.0% |
10.0% |
| favorite |
0-2-1-7 |
0% |
20.0% |
30.0% |
| 6th-9th favorite |
5-2-1-32 |
12.5% |
17.5% |
20.0% |
| 10th favorite or lower |
0-2-4-72 |
0% |
2.6% |
7.7% |
Also focus on horse number
Looking at performances by runners over the last 10 years in terms of their horse number, the runners can be divided into three groups. Runners with numbers “4-6” have produced the highest number of winners (four). If we limit our analysis to the races from 2015, we observe that this group has produced three winners, one runner-up, and one third-place finisher, and has consistently entered the Top 3 in the last five years. Runners with numbers “1-3” have delivered zero winners, but four runners-up and three third-place finishers. Runners with numbers “10-12” have produced a total of seven Top 3 finishers, including three winners. It may therefore be interesting to check runners with horse numbers that have often been tied to strong performance in the past. [Table 2]
[Table 2] Performance by horse number (last 10 years)
| Horse number |
Performance
[1st-2nd-3rd-4th or lower] |
Win ratio |
Top 2 ratio |
Top 3 ratio |
| 1-3 |
0-4-3-23 |
0% |
13.3% |
23.3% |
| 4-6 |
4-1-1-24 |
13.3% |
16.7% |
20.0% |
| 7-9 |
0-2-1-27 |
0% |
6.7% |
10.0% |
| 10-12 |
3-1-3-23 |
10.0% |
13.3% |
23.3% |
| 13-15 |
2-1-1-23 |
7.4% |
11.1% |
14.8% |
| 16-18 |
1-1-1-18 |
4.8% |
9.5% |
14.3% |
Keep close watch on runners coming off consecutive victories
Looking at performances by runners over the last 10 years in terms of finish in their previous race, we find that Satono Aladdin was the only runner to win the race after having been beaten to 5th or lower in his previous race (9th finish) in 2017. This means nine of the 10 last winners had finished in the Top 4 of their previous race. Moreover, runners that had won their previous race have entered the Top 3 nine times over the last 10 years (2012 being the exception). Although we should not overlook runners that have been beaten to 5th or lower in their previous race (nine Top 3 finishers in our data), our primary focus should be on runners that have risen to the top in their previous race. [Table 3]
[Table 3] Performance by finish in previous race (last 10 years)
| Finish in previous race |
Performance
[1st-2nd-3rd-4th or lower] |
Win ratio |
Top 2 ratio |
Top 3 ratio |
| 1st |
4-2-3-28 |
10.8% |
16.2% |
24.3% |
| 2nd |
2-2-0-26 |
6.7% |
13.3% |
13.3% |
| 3rd |
1-1-2-18 |
4.5% |
9.1% |
18.2% |
| 4th |
2-1-1-15 |
10.5% |
15.8% |
21.1% |
| 5th |
0-1-2-9 |
0% |
8.3% |
25.0% |
| 6th-9th |
1-3-1-17 |
4.5% |
18.2% |
22.7% |
| 10th or lower |
0-0-1-25 |
0% |
0% |
3.8% |
In addition, looking at performances by runners that had won their previous race in terms of finish in their last-but-one race, runners that had similarly notched a win in their last-but-one race achieved a Top 2 ratio of 42.9% and Top 3 ratio of 57.1%. Conversely, runners that had finished 2nd or lower in their last-but-once race produced zero Top 2 finishers and only one third-place finisher. Among runners that have won their previous race, we should sharply raise our expectations of those that had also won their last-but-one race (in other words, runners that are coming off consecutive victories). [Table 4]
[Table 4] Among runners that had finished 1st in previous race, performance by finish in last-but-one race (last 10 years)
| Finish in last-but-one race |
Performance
[1st-2nd-3rd-4th or lower] |
Win ratio |
Top 2 ratio |
Top 3 ratio |
| 1st |
4-2-2-6 |
28.6% |
42.9% |
57.1% |
| 2nd or lower |
0-0-1-22 |
0% |
0% |
4.3% |
Strong performance by runners coming from race other than turf 1,600m race in recent years
Looking at performances by runners over the last 10 years in terms of the distance of their previous race, we observe that 15 of the 30 Top 3 finishers had contested a “turf 1,600m” race in their previous race. However, runners that had contested a “turf 1,800m” race in their previous race achieved the highest success ratios with comprising a relatively small group of 11 runners. [Table 5]
[Table 5] Performance by distance of previous race (last 10 years)
| Distance of previous race |
Performance
[1st-2nd-3rd-4th or lower] |
Win ratio |
Top 2 ratio |
Top 3 ratio |
| Turf 1,200m |
1-0-0-6 |
14.3% |
14.3% |
14.3% |
| Turf 1,400m |
3-3-1-32 |
7.7% |
15.4% |
17.9% |
| urf 1,600m |
4-5-6-74 |
4.5% |
10.1% |
16.9% |
| Turf 1,800m |
2-1-1-7 |
18.2% |
27.3% |
36.4% |
| Turf 2,000m |
0-1-2-13 |
0% |
6.3% |
18.8% |
| Turf 2,200m+ |
0-0-0-4 |
0% |
0% |
0% |
| Dirt race |
0-0-0-2 |
0% |
0% |
0% |
In addition, of the 50 runners that have entered the race in the three years since 2017, 24 runners had contested a turf 1,600m race in their previous race, and 26 a race other than a turf 1,600m race. The latter group delivered a higher Top 3 ratio and number of Top 3 finishers. We should therefore keep in mind that runners that had contested a race other than a turf 1,600m race in their previous race have performed well in recent years. [Table 6]
[Table 6] Performance by distance of previous race (last 3 years)
| Distance of previous race |
Performance
[1st-2nd-3rd-4th or lower] |
Win ratio |
Top 2 ratio |
Top 3 ratio |
| Turf 1,600m |
1-2-0-21 |
4.2% |
12.5% |
12.5% |
| Other than turf 1,600m |
2-1-3-20 |
7.7% |
11.5% |
23.1% |
Seek out the winner!
Check favoritism in open-class race held in same year
The three winners since 2017 had all contested an open-class race backed as 1st favorite in the same year, and had not contested races backed as 3rd favorite or lower in that year. In other words, we should focus on runners that have consistently been highly favored since the start of the year. [Table 7]
[Table 7] Winners’ favoritism in open-class race contested in same year (last 3 years)
| Year |
Winner |
Race in question |
| 2017 |
Satono Aladdin |
Keio Hai Spring Cup: 1st favorite |
| 2018 |
Mozu Ascot |
Hankyu Hai: 1st favorite, Yomiuri Milers Cup:
2nd
favorite, Azuchijo Stakes: 1st favorite |
| 2019 |
Indy Champ |
Tokyo Shimbun Hai: 1st favorite, Yomiuri Milers Cup:
2nd favorite |
(Michio Kawano)
|

- Preview
- Barrier draw
- Past performances of runners

- News
- Race result
- Video
- 2025 English

- 2024 English

- 2023 English

- 2022 English

- 2021 English

- 2020 English

- 2019 English

- 2018 English

- 2017 English

- 2016 English

- 2015 English

- 2014 English

- 2013 English

- Photo Gallery
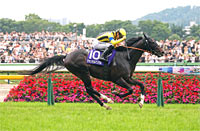
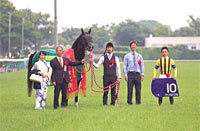
2025 Winner: Jantar Mantar
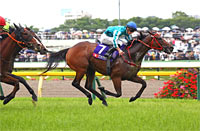
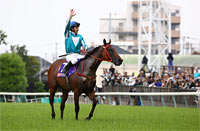
2024 Winner: ROMANTIC WARRIOR



|


