Oka Sho (Japanese 1000 Guineas) (G1) - Data Analysis
First leg of the Fillies’ Triple Crown
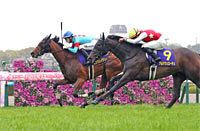
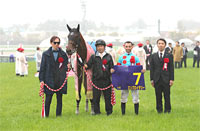
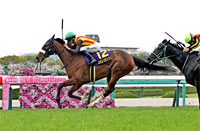
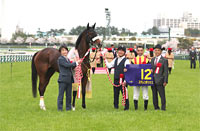
The classic races in 2022 will kick off with the Oka Sho (Japanese 1000 Guineas), in which the best three-year-old fillies are set to compete for the title of “cherry blossom” champion against a backdrop of cherry blossoms at Hanshin Racecourse. Let’s now analyze the data for the last 10 years.
Focus on previous race
Among runners that had previously contested one of the three trial races for the Oka Sho (Tulip Sho, Hochi Hai Fillies’ Revue, or Anemone Stakes), those coming from the Tulip Sho delivered by far the strongest performance. Over the last 10 years, the highest number of Oka Sho runners came from the Hochi Hai Fillies’ Revue, but only three runners in this group finished in the Top 3. Meanwhile, none of the 23 runners coming from the Anemone Stakes achieved a Top 3 finish. Based on these results, we should focus not only on runners that have previously contested the Tulip Sho (which appears to be positively correlated with the Oka Sho), but also runners coming from non-trial races. [Table 1]
[Table 1] Performance by previous race (last 10 years)
| Previous race |
Performance
[1st-2nd-3rd-4th or lower] |
Win ratio |
Top 2 ratio |
Top 3 ratio |
| Tulip Sho |
5-7-6-29 |
10.6% |
25.5% |
38.3% |
| Hanshin Juvenile Fillies |
1-2-0-2 |
20.0% |
60.0% |
60.0% |
| Hochi Hai Fillies’ Revue |
1-0-2-49 |
1.9% |
1.9% |
5.8% |
| Elfin Stakes |
1-0-0-4 |
20.0% |
20.0% |
20.0% |
| Asahi Hai Futurity Stakes |
1-0-0-1 |
50.0% |
50.0% |
50.0% |
| Nikkan Sports Sho Shinzan Kinen |
1-0-0-1 |
50.0% |
50.0% |
50.0% |
| Daily Hai Queen Cup |
0-1-1-16 |
0% |
5.6% |
11.1% |
| Fairy Stakes |
0-0-1-3 |
0% |
0% |
25.0% |
| Anemone Stakes |
0-0-0-23 |
0% |
0% |
0% |
| Other race |
0-0-0-20 |
0% |
0% |
0% |
Note: Races that underwent a change in status during the analysis period have been treated as the same race.
Consistent performance by runners with 3 or more wins
Among the last 10 winners, eight had achieved 2 or fewer wins in previous JRA races. Although this can be attributed to the fact that runners with 2 previous wins made up the largest group of runners competing in the Oka Sho (99 in total), we note that runners with 1 previous win (37) produced three winners, and runners with 3 previous wins (36) one winner. This appears to suggest that runners with fewer previous wins fare better. That said, runners with 3 and 4 previous wins achieved Top 3 ratios of 22.2% and 50.0%, respectively, so runners with 3 or more previous wins have the edge in terms of consistent performance. It may therefore be a good idea to consider runners with a higher number of previous wins. [Table 2]
[Table 2] Performance by number of wins in JRA races (last 10 years)
| Number of wins |
Performance
[1st-2nd-3rd-4th or lower] |
Win ratio |
Top 2 ratio |
Top 3 ratio |
| 4 |
1-1-1-3 |
16.7% |
33.3% |
50.0% |
| 3 |
1-4-3-28 |
2.8% |
13.9% |
22.2% |
| 2 |
5-4-6-84 |
5.1% |
9.1% |
15.2% |
| 1 |
3-1-0-33 |
8.1% |
10.8% |
10.8% |
Strong performance by runners backed as 2nd favorite
Looking at performances by runners over the last 10 years in terms of favoritism, we find that runners backed as 2nd favorite delivered strong performance with eight Top 2 finishes and five victories over the last 10 years (including four consecutive victories from 2018). While the performance of race favorites was slightly underwhelming, their Top 3 ratio of 50.0% was on par with runners backed as 3rd favorite. Overall, runners backed as 3rd or higher achieved the highest Top 3 ratios. Conversely, poorly favored runners struggled considerably, with the 88 runners backed as 10th favorite or lower producing only one third-place finisher. [Table 3]
[Table 3] Performance by favoritism (last 10 years)
| Favoritism |
Performance
[1st-2nd-3rd-4th or lower] |
Win ratio |
Top 2 ratio |
Top 3 ratio |
| 1st favorite |
1-3-1-5 |
10.0% |
40.0% |
50.0% |
| 2nd favorite |
5-3-0-2 |
50.0% |
80.0% |
80.0% |
| 3rd favorite |
1-1-3-5 |
10.0% |
20.0% |
50.0% |
| 4th favorite |
0-1-0-9 |
0% |
10.0% |
10.0% |
| 5th favorite |
1-0-1-8 |
10.0% |
10.0% |
20.0% |
| 6th-9th favorite |
2-2-4-32 |
5.0% |
10.0% |
20.0% |
| 10th favorite or lower |
0-0-1-87 |
0% |
0% |
1.1% |
Runners that have achieved several Top 2 finishes in recent turf mile races have the edge
Eight of the 10 winners and 19 of the 30 Top 3 finishers over the last 10 years had achieved two or more Top 2 finishes in 1,600m turf races within their last three outings. Runners in this group also enjoyed high success ratios, so we need to take into account performance in recent mile races. [Table 4]
[Table 4] Performance by Top 2 finishes in 1,600m turf races within last three outings (last 10 years)
| Top 2 finishes |
Performance
[1st-2nd-3rd-4th or lower] |
Win ratio |
Top 2 ratio |
Top 3 ratio |
| 3 |
1-2-1-10 |
7.1% |
21.4% |
28.6% |
| 2 |
7-4-4-30 |
15.6% |
24.4% |
33.3% |
| 1 |
1-3-2-50 |
1.8% |
7.1% |
10.7% |
| 0 |
1-1-3-58 |
1.6% |
3.2% |
7.9% |
Seek out the winner!
Check win conditions in open-class races
The five winners since 2017 all had experience of winning an Open-Class race with a time difference of 0.3s or more with the runner-up in that race. This year, we should again pay attention to victories in open-class races, and the time difference with the runner-up in such races. [Table 5]
[Table 5] Winners’ performance by highest time difference with runner-up in open-class race (last five years)
| Year |
Winner |
Highest time difference with runner-up |
| 2017 |
Reine Minoru |
1.0s |
| 2018 |
Almond Eye |
0.3s |
| 2019 |
Gran Alegria |
0.6s |
| 2020 |
Daring Tact |
0.7s |
| 2021 |
Sodashi |
0.3s |
(Michio Kawano)
|


