2016 News
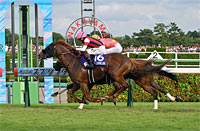
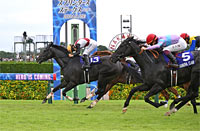
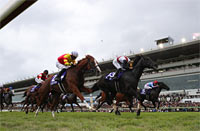
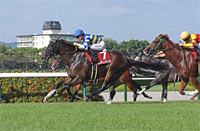
Data Analysis for the Sprinters StakesIt’s time for the autumn sprint king decider! As well as deciding the autumn’s champion sprinter, the Sprinters Stakes also raises the curtain on the autumn G1 program. This race always delivers a thrilling spectacle – such as in 2005, 2006 and 2010, when it was won by horses trained overseas, or in 2012 and 2013, when Lord Kanaloa culled back-to-back victories to cap a splendid career in short-distance racing at home and abroad. But before this long-awaited opening of the G1 autumn season, let’s explore some trends shared by successful horses in this race, based on results over the last 10 years (including 2014, when it was held at Niigata Racecourse). Check the number of starts since July If we aggregate the performances of runners over the last 10 years in terms of the number of starts since July, we find that horses with “1” start in that period have enjoyed the highest success ratios. In fact, seven of the 10 winning horses came to this race with just one start in that time. While the Sprinters Stakes is often contested by horses recently returning from recuperation as well as active participants in the Summer Sprint Series, our attention should first be on runners with only one start since July. [Table 1] [Table 1] Performance by number of starts since July (last 10 years)
3rd place finishers no higher than 5th favorite Turning to performances over the last 10 years by favoritism to win the race, better success ratios have been marked by the “1st-3rd favorite.” In particular, runners in the “1st favorite” and “2nd favorite” groups have each achieved a Top 2 ratio of 50% or more. A curious statistic is that all 10 of the 3rd place finishers were backed as “5th favorite or lower.” When trying to predict which horse will finish in 3rd place, it might be interesting to aim for horses with lower favoritism. [Table 2] [Table 2] Performance by favoritism (last 10 years)
Any trends based on horse number? Looking at performances by horse number over the last 10 times when this race has been held at Nakayama since 2005 (i.e. excluding 2014, when it was held at Niigata), horses with the best success ratios are those in the outer numbers “13-16.” This group has produced five winners and by far the best Win ratio. The next best score in Top 2 and Top 3 ratios is marked by horses with numbers “1-4,” but those with numbers in the middle range don’t seem to do so well. [Table 3] [Table 3] Performance by horse number (last 10 times held at Nakayama Racecourse)
Strong showing by runners from that year’s Takamatsunomiya Kinen Next, let’s check performances of runners over the last 10 years by their finish in the Takamatsunomiya Kinen, held in spring of the same year. As a result, we find that horses that contested the Takamatsunomiya Kinen have scored better success ratios than horses that did not; for example, groups finishing “1st-3rd” in that race have achieved Top 2 ratios of 25% in this one. It might therefore be useful to check whether this year’s runners appeared in the Takamatsunomiya Kinen, and how they finished in that race. [Table 4] [Table 4] Performance by finish in that year's Takamatsunomiya Kinen (T Kinen) (last 10 years)
Seek out the winner! The last five winning horses since 2011 had all been backed as the favorite to win a 1,200m race within their previous three outings. Runners that have enjoyed strong support by punters in recent races should not be overlooked. [Table 5] [Table 5] Performance by highest favoritism to win a 1,200m race in the last three outings (last 5 years)
(Michio Kawano) |
|


