Tenno Sho (Autumn) (G1) - Data Analysis
Race steeped in tradition opens the autumn G1 season for older horses
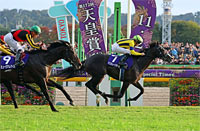
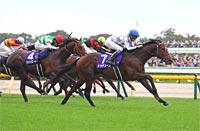
The Tenno Sho (Autumn) is the first of three successive G1 middle- to long-distance contests for the autumn season, to be followed by the Japan Cup and the Arima Kinen (Grand Prix). This race has produced some thrilling spectacles befitting the very best of domestic G1 middle- to long-distance racing in recent years; in 2008, for example, the two mares Vodka and Daiwa Scarlet raced neck-and-neck to the finish, while in 2009 Company became the first 8-year-old in JRA history to snatch a G1 flat racing title. As we approach this pulsating fixture, let's look for some telling trends in results over the last 10 years.
Dominance of horses backed by strong favoritism in recent outings
If we aggregate performances by runners over the last 10 years in terms of their highest favoritism in their previous two races, we find that 25 of the 30 Top 3 finishers had a highest favoritism of “1st favorite” or “2nd favorite.” In success ratios, a sizeable gap appears between the “2nd favorite” and “3rd favorite.” Our focus should be on form horses and runners with a record of strong backing in recent outings. [Table 1]
[Table 1] Performance by highest favoritism in the last 2 races (last 10 years)
| Highest favoritism |
Performance
[1st-2nd-3rd-4th or lower] |
Win ratio |
Top 2 ratio |
Top 3 ratio |
| 1st favorite |
7-5-6-34 |
13.5% |
23.1% |
34.6% |
| 2nd favorite |
2-2-3-23 |
6.7% |
13.3% |
23.3% |
| 3rd favorite |
0-1-0-19 |
0% |
5.0% |
5.0% |
| 4th favorite |
1-0-1-20 |
4.5% |
4.5% |
9.1% |
| 5th favorite |
0-1-0-16 |
0% |
5.9% |
5.9% |
| 6th-9th favorite |
0-1-0-25 |
0% |
3.8% |
3.8% |
| 10th favorite or lower |
0-0-0-5 |
0% |
0% |
0% |
Note 1: Not including overseas races.
Note 2: One runner had appeared in overseas races for both of the previous two outings.
A good record in recent turf G1 races is also key
Turning next to performances of runners over the last 10 years in terms of their highest finish in turf G1 races within their last two outings, those with a highest finish of “1st” and “2nd” have achieved Top 2 and Top 3 ratios in this race. Contrastingly, horses with no record of a Top 2 finish in turf G1 races within the last two outings and those with no record of contesting turf G1 races within the last two outings also have low success ratios. We should put more faith in horses with a record of a Top 2 finish in recent turf G1 races. [Table 2]
[Table 2] Performance by highest finish in turf G1 races within the last two outings (last 10 years)
| Highest finish |
Performance
[1st-2nd-3rd-4th or lower] |
Win ratio |
Top 2 ratio |
Top 3 ratio |
| 1st |
4-2-3-10 |
21.1% |
31.6% |
47.4% |
| 2nd |
1-4-1-7 |
7.7% |
38.5% |
46.2% |
| 3rd |
0-0-2-6 |
0% |
0% |
25.0% |
| 4th |
1-0-0-8 |
11.1% |
11.1% |
11.1% |
| 5th |
0-1-1-3 |
0% |
20.0% |
40.0% |
| 6th-9th |
2-1-1-22 |
7.7% |
11.5% |
15.4% |
| 10th or lower |
0-0-1-24 |
0% |
0% |
4.0% |
| No turf G1 in last 2 races |
2-2-1-63 |
2.9% |
5.9% |
7.4% |
Note: Including overseas races.
Check the recent record on turf at Tokyo
Viewing the performance of runners over the last 10 years in terms of their highest finish in turf races at Tokyo Racecourse within their previous three outings, those with a highest finish of “1st” and “2nd” have accumulated win ratios in excess of 10% here. These also excel in both the Top 2 and Top 3 ratios. Of course, we should not overlook the fact that nine runners with no experience of racing on turf at Tokyo in their previous three outings have finished in the Top 3 here. Nevertheless, we should keep a firm eye on those with a record of finishing in the Top 2 in such races within their previous three outings. [Table 3]
[Table 3] Performance by highest finish on turf at Tokyo in the previous three races (last 10 years)
| Highest finish |
Performance
[1st-2nd-3rd-4th or lower] |
Win ratio |
Top 2 ratio |
Top 3 ratio |
| 1st |
4-4-3-16 |
14.8% |
29.6% |
40.7% |
| 2nd |
2-1-1-12 |
12.5% |
18.8% |
25.0% |
| 3rd |
0-0-1-8 |
0% |
0% |
11.1% |
| 4th |
0-0-0-4 |
0% |
0% |
0% |
| 5th |
0-0-2-4 |
0% |
0% |
33.3% |
| 6th-9th |
1-1-0-22 |
4.2% |
8.3% |
8.3% |
| 10th or lower |
0-1-0-9 |
0% |
10.0% |
10.0% |
| No such race entered |
3-3-3-68 |
3.9% |
7.8% |
11.7% |
Focus on most recent record over distance
When aggregating performances of runners over the last 10 years by their most recent finish in a 1,600-2,000m turf race, those with the better Top 3 ratios here are the ones that finished “1st” to “3rd” and “5th” in that race. And although five horses finishing “6th or lower” have made it into the Top 2 here, those with a higher finish in a 1,600-2,000m turf race have achieved better success ratios in this one. This year, too, we should check the runners’ most recent finish in a 1,600-2,000m turf race. [Table 4]
[Table 4] Performance by most recent finish in a 1,600-2,000m turf race (last 10 years)
| Finish |
Performance
[1st-2nd-3rd-4th or lower] |
Win ratio |
Top 2 ratio |
Top 3 ratio |
| 1st |
5-3-6-30 |
11.4% |
18.2% |
31.8% |
| 2nd |
3-2-2-10 |
17.6% |
29.4% |
41.2% |
| 3rd |
1-0-1-17 |
5.3% |
5.3% |
10.5% |
| 4th |
0-0-0-16 |
0% |
0% |
0% |
| 5th |
0-1-1-7 |
0% |
11.1% |
22.2% |
| 6th-9th |
1-2-0-40 |
2.3% |
7.0% |
7.0% |
| 10th or lower |
0-2-0-23 |
0% |
8.0% |
8.0% |
Note: Including NAR and overseas races.
Seek out the winner!
Four straight wins by runners with two or more Top 2 finishes in their last three outings
All four winners since 2013 had achieved two or more Top 2 finishes in their previous three outings. What’s more, none of them had finished lower than 3rd in those races. When looking for potential winners, our focus should be on horses that have consistently been among the front runners in recent outings. [Table 5]
[Table 5] Last three finishes by winning horses (last 4 years)
| Year |
Winning horse |
Win ratio |
Top 2 ratio |
Top 3 ratio |
| 2013 |
Just a Way |
2nd |
2nd |
2nd |
| 2014 |
Spielberg |
1st |
1st |
3rd |
| 2015 |
Lovely Day |
1st |
1st |
1st |
| 2016 |
Maurice |
1st |
2nd |
2nd |
(Michio Kawano) |


