Takarazuka Kinen (G1) – Data Analysis
Climax of the spring G1 racing program
The Takarazuka Kinen, which concludes the spring G1 racing program, brings together a lineup of top performers in middle- to long-distance races for older horses, and has historically delivered a large number of memorable contests. Let’s now analyze the biggest trends in this curtain closer of the spring G1 racing program based on results over the last 10 years.
Watch finish in first race of the year
Looking at performances by runners over the last 10 years in terms of finish in their first race of the year, we find that eight of the 10 winners and 15 of the 20 Top 2 finishers had finished in the Top 3 of their first race of the year. Runners that had finished in the Top 3 of their first race of the year achieved a Top 3 ratio of over 30%. There were a total of 74 such runners, which was comparable to the 72 that had finished 4th or lower in such a race or had not entered a previous race in the applicable year. In other words, when comparing this year’s runners, it should be interesting to check the finish in their first race of the year. [Table 1]
[Table 1] Finish in first race of the year (last 10 years)
| Finish |
Performance
[1st-2nd-3rd-4th or lower] |
Win ratio |
Top 2 ratio |
Top 3 ratio |
| 1st |
5-4-3-27 |
12.8% |
23.1% |
30.8% |
| 2nd |
1-2-4-15 |
4.5% |
13.6% |
31.8% |
| 3rd |
2-1-1-9 |
15.4% |
23.1% |
30.8% |
| 4th |
1-0-0-10 |
9.1% |
9.1% |
9.1% |
| 5th |
0-1-0-4 |
0% |
20.0% |
20.0% |
| 6th-9th |
1-1-1-28 |
3.2% |
6.5% |
9.7% |
| 10th or lower |
0-1-1-20 |
0% |
4.5% |
9.1% |
No previous race
contested in
applicable year |
0-0-0-3 |
0% |
0% |
0% |
Runners backed as 3rd favorite or higher in previous race have an edge
Looking at performances by runners over the last 10 years in terms of favoritism in their previous race, we observe that 8 of the 10 winners were backed as 3rd favorite or higher in their previous race. Runners that were highly favored in their previous race, including those backed as 5th favorite, delivered strong performances. However, the 14 runners that were backed as 4th favorite in their previous race produced zero Top 3 finishers, which is an interesting statistic. In addition, the 16 runners that contested their previous race overseas produced three runners-up but zero winners. This group included 2016 runner-up Duramente, which was the race favorite that year. [Table 2]
[Table 2] Performance by favoritism in previous race (last 10 years)
Favoritism in
previous race |
Performance
[1st-2nd-3rd-4th or lower] |
Win ratio |
Top 2 ratio |
Top 3 ratio |
| 1st favorite |
3-3-3-17 |
11.5% |
23.1% |
34.6% |
| 2nd favorite |
2-1-2-14 |
10.5% |
15.8% |
26.3% |
| 3rd favorite |
3-1-1-16 |
14.3% |
19.0% |
23.8% |
| 4th favorite |
0-0-0-14 |
0% |
0% |
0% |
| 5th favorite |
1-1-0-5 |
14.3% |
28.6% |
28.6% |
| 6th-9th favorite |
1-1-1-12 |
6.7% |
13.3% |
20.0% |
| 10th favorite or lower |
0-0-2-26 |
0% |
0% |
7.1% |
| Previous race contested overseas |
0-3-1-12 |
0% |
18.8% |
25.0% |
Comeback by runners that recently experienced defeat in a G1 turf race
Looking at performances by runners over the last 10 years in terms of finish in their latest G1 turf race contested within the last three outings, we note that the 10 winners all had contested a G1 turf race within their last three outings and had been beaten to 3rd or lower in that race. Runners that had finished 1st or 2nd in such a race delivered zero winners, but the latter group achieved a strong Top 3 ratio of 42.9%, producing a total of 10 runners-up and third-place finishers. In addition, runners that had finished 3rd to 5th in their latest G1 turf race contested within the last three outings delivered five winners but zero runners-up or third-place finishers. These trends could be considered useful statistics when planning bet formations. [Table 3]
[Table 3] Performance by finish in G1 turf race contested within last three outings (last 10 years)
| Finish |
Performance
[1st-2nd-3rd-4th or lower] |
Win ratio |
Top 2 ratio |
Top 3 ratio |
| 1st |
0-2-2-11 |
0% |
13.3% |
26.7% |
| 2nd |
0-3-3-8 |
0% |
21.4% |
42.9% |
| 3rd |
2-0-0-8 |
20.0% |
20.0% |
20.0% |
| 4th |
2-0-0-5 |
28.6% |
28.6% |
28.6% |
| 5th |
1-0-0-6 |
14.3% |
14.3% |
14.3% |
| 6th-9th |
3-1-2-20 |
11.5% |
15.4% |
23.1% |
| 10th or lower |
2-1-0-27 |
6.7% |
10.0% |
10.0% |
No G1 race contested within
last three outings |
0-3-3-31 |
0% |
8.1% |
16.2% |
Note: Disqualified runners counted as finishing last.
Top win ratios for runners that contested the Tenno Sho (Spring) in the same year
Looking at performances by runners over the last 10 years in terms of experience of contesting the Tenno Sho (Spring) in the same year, we find that Top 2 and Top 3 ratios were similar for runners with and without such experience, but that the Win ratios for both groups revealed a difference. [Table 4]
[Table 4] Performance by experience of contesting the Tenno Sho (Spring) in the same year (last 10 years)
| Experience |
Performance
[1st-2nd-3rd-4th or lower] |
Win ratio |
Top 2 ratio |
Top 3 ratio |
| Yes |
6-2-2-38 |
12.5% |
16.7% |
20.8% |
| No |
4-8-8-78 |
4.1% |
12.2% |
20.4% |
There were a total of 98 runners that did not run in the Tenno Sho (Spring) the same year. Looking at performances in terms of their highest finish in a turf 2,200m race contested within their last four outings, we observe that the four winners out of this group had finished in the Top 3 of such a race. Runners that had triumphed in such a race achieved a high Top 2 ratio of 40.0%. In addition, runners that had not contested a turf 2,200m race within their last four outings produced four runners-up but no winners. When comparing runners that have not contested the Tenno Sho (Spring) of this year, we should focus on their finish in a recent turf 2,200m race. [Table 5]
[Table 5] Among runners that had not contested the Tenno Sho (Spring) in the same year, performance by highest finish in turf 2,200m race contested within last four outings (last 10 years)
| Highest finish |
Performance
[1st-2nd-3rd-4th or lower] |
Win ratio |
Top 2 ratio |
Top 3 ratio |
| 1st |
3-3-0-9 |
20.0% |
40.0% |
40.0% |
| 2nd |
0-1-0-6 |
0% |
14.3% |
14.3% |
| 3rd |
1-0-1-4 |
16.7% |
16.7% |
33.3% |
| 4th or lower |
0-0-1-13 |
0% |
0% |
7.1% |
| Not such race entered |
0-4-6-46 |
0% |
7.1% |
17.9% |
Seek out the winner!
Watch performance in recent G1 race
Looking at performances by the last 10 winners in terms of their finish in a G1 race contested within their last three outings, we note that 3 of the winners had notched a win in a G1 race. Six of the remaining 7 winners had a lowest time difference of 0.5s or less with the winner of that G1 race loss. In other words, runners that have recently entered a G1 race, and either won that race or were defeated with a narrow time difference with the winner in that race, should be regarded as leading contenders. [Table 6]
[Table 6] For winners, G1 race won within last three outings, or lowest time difference with winner of G1 race lost within last three outings (last 10 years)
| Year |
Winner |
G1 race won within last three outings, or lowest time
difference with winner of G1 race lost within last three outings |
| 2009 |
Dream Journey |
0.3s (Tenno Sho (Spring)) |
| 2010 |
Nakayama Festa |
1.7s (Kikuka Sho (Japanese St. Leger)) |
| 2011 |
Earnestly |
0.5s (Tenno Sho (Autumn)) |
| 2012 |
Orfevre |
Arima Kinen (Grand Prix) 1st |
| 2013 |
Gold Ship |
Arima Kinen (Grand Prix) 1st |
| 2014 |
Gold Ship |
0.5s (Tenno Sho (Spring)) |
| 2015 |
Lovely Day |
0.5s (Tenno Sho (Spring)) |
| 2016 |
Marialite |
0.1s (Arima Kinen (Grand Prix)) |
| 2017 |
Satono Crown |
Hong Kong Vase 1st |
| 2018 |
Mikki Rocket |
0.2s (Tenno Sho (Spring)) |
(Michio Kawano)
|

- Preview
- Barrier draw
- Past performances of runners

- News
- Race result
- Video
(English racecall for races after 2006)
- 2026

- 2025
- 2024
- 2023
- 2022
- 2021
- 2020
- 2019
- 2018
- 2017
- 2016
- 2015
- 2014
- 2013
- Photo Gallery
2026 Winner: Meisho Tabaru
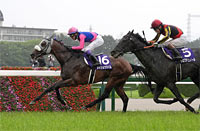
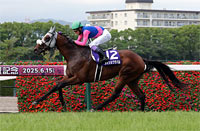
2025 Winner: Meisho Tabaru
|

")


','../en/racing/news_media/gallery/img/2026/s2/260614a.jpg','../en/racing/news_media/gallery/img/2026/b/260614a.jpg'))
','../en/racing/news_media/gallery/img/2026/s2/260614b.jpg','../en/racing/news_media/gallery/img/2026/b/260614b.jpg'))
','../en/racing/news_media/gallery/img/2025/s2/250615a.jpg','../en/racing/news_media/gallery/img/2025/b/250615a.jpg'))
','../en/racing/news_media/gallery/img/2025/s2/250615b.jpg','../en/racing/news_media/gallery/img/2025/b/250615b.jpg'))
