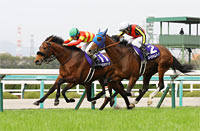
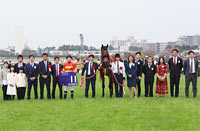
Osaka Hai (G1) - Data Analysis
Ultimate spring middle-distance contest for older horses at Hanshin Racecourse
The Osaka Hai was held as a G2 race until 2016, and this year marks the fourth year since the race was upgraded to G1 status in 2017. The race attracts the top runners for middle-distance races for older horses, resulting in a ferocious battle every year. Let’s now identify some trends in this race based on results for the Osaka Hai races over the last three years, and for turf 2,000m G2 or G3 races held at Hanshin Racecourse (excluding races for 2-year-olds and handicap races) over the last 10 years.
Highly favored runners have the edge
Looking at performances by runners in the Osaka Hai races since 2017 (when the race was upgraded to G1 status) in terms of favoritism, we find that race favorites produced two winners, runners backed as 2nd favorite one runner-up, and runners backed as 6th-9th favorite one winner and two runners-up. [Table 1]
[Table 1] Performance by favoritism (last 3 years)
| Favoritism |
Performance
[1st-2nd-3rd-4th or lower] |
Win ratio |
Top 2 ratio |
Top 3 ratio |
| 1st favorite |
2-0-0-1 |
66.7% |
66.7% |
66.7% |
| 2nd favorite |
0-1-1-1 |
0% |
33.3% |
66.7% |
| 3rd favorite |
0-0-0-3 |
0% |
0% |
0% |
| 4th favorite |
0-0-2-1 |
0% |
0% |
66.7% |
| 5th favorite |
0-0-0-3 |
0% |
0% |
0% |
| 6th-9th favorite |
1-2-0-9 |
8.3% |
25.0% |
25.0% |
| 10th favorite or lower |
0-0-0-17 |
0% |
0% |
0% |
Next, looking at performances by runners in turf 2,000m G2 or G3 races held at Hanshin Racecourse (excluding races for 2-year-olds and handicap races) over the last 10 years in terms of favoritism, the first takeaway is that runners backed as 1st and 2nd favorites achieved high Top 3 ratios of over 60%. Also worthy of note is the fact that many runners backed as 6th-9th favorites performed well. These two data points are consistent with the trends in [Table 1]. In other words, while we should again keep an eye on highly favored runners this year, we should not overlook the possibility of a dark horse taking everyone by surprise. [Table 2]
[Table 2] Performance by favoritism in turf 2,000m G2 or G3 races held at Hanshin Racecourse (excluding races for 2-year-olds and handicap races) (last 10 years)
| Favoritism |
Performance
[1st-2nd-3rd-4th or lower] |
Win ratio |
Top 2 ratio |
Top 3 ratio |
| 1st favorite |
6-5-3-6 |
30.0% |
55.0% |
70.0% |
| 2nd favorite |
7-2-4-7 |
35.0% |
45.0% |
65.0% |
| 3rd favorite |
2-1-3-14 |
10.0% |
15.0% |
30.0% |
| 4th favorite |
2-1-3-14 |
10.0% |
15.0% |
30.0% |
| 5th favorite |
0-3-3-14 |
0% |
15.0% |
30.0% |
| 6th-9th favorite |
3-8-2-66 |
3.8% |
13.9% |
16.5% |
| 10th favorite or lower |
0-0-2-52 |
0% |
0% |
3.7% |
Focus on runners that tend to occupy a leading position
Looking at performances by runners in terms of their position when passing the 4th corner in the Osaka Hai races over the last three years, we observe that five of the six Top 2 finishers passed the 4th corner in 4th or higher position. Although runners that passed the 4th corner in 5th-9th position achieved roughly the same Top 3 ratio, the bulk of the Top 2 finishers occupied a leading position throughout the race. [Table 3]
[Table 3] Performance by position when passing the 4th corner (last 3 years)
Position when
passing 4th corner |
Performance
[1st-2nd-3rd-4th or lower] |
Win ratio |
Top 2 ratio |
Top 3 ratio |
| Leader |
1-0-0-2 |
33.3% |
33.3% |
33.3% |
| 2nd-4th |
2-2-0-8 |
16.7% |
33.3% |
33.3% |
| 5th-9th |
0-1-3-9 |
0% |
7.7% |
30.8% |
| 10th or lower |
0-0-0-16 |
0% |
0% |
0% |
Looking at performances by runners in terms of their position when passing the 4th corner in turf 2,000m G2 or G3 races held at Hanshin Racecourse (excluding races for 2-year-olds and handicap races) over the last 10 years, we do not see any notable differences from the trends in [Table 3], but we find that runners in the lead and those in 2nd-4th position when passing the 4th corner enjoyed the highest success ratios. In other words, it would be hard to ignore runners that are likely to be in the lead or actively chase position in the race. [Table 4]
[Table 4] Performance by position when passing the 4th corner in turf 2,000m G2 or G3 races held at Hanshin Racecourse (excluding races for 2-year-olds and handicap races) (last 10 years)
Position when
passing
4th corner |
Performance
[1st-2nd-3rd-4th or lower] |
Win ratio |
Top 2 ratio |
Top 3 ratio |
| Leader |
3-3-1-13 |
15.0% |
30.0% |
35.0% |
| 2nd-4th |
7-7-6-51 |
9.9% |
19.7% |
28.2% |
| 5th-9th |
8-6-12-70 |
8.3% |
14.6% |
27.1% |
| 10th or lower |
2-4-1-39 |
4.3% |
13.0% |
15.2% |
Check performance in recent G1 races
Looking at performances of runners over the last three years in terms of their highest finish in G1 races contested within their last three outings, we find that the six Top 2 finishers all had a highest finish of 4th or higher in such a race. Runners with a highest finish of 5th or lower produced only one Top 3 finisher. While our sample group only covers three years, the data suggest we should focus on runners that have performed favorably in recent GI races. However, while five runners over the last three years had won a recent G1 race, we note that these produced not a single winner, delivering performance of [0-1-1-3]. [Table 5]
[Table 5] Performance by highest finish in G1 race within last three outings (last 3 years)
| Highest finish |
Performance
[1st-2nd-3rd-4th or lower] |
Win ratio |
Top 2 ratio |
Top 3 ratio |
| 1st |
1-1-1-4 |
14.3% |
28.6% |
42.9% |
| 2nd |
0-1-0-3 |
0% |
25.0% |
25.0% |
| 3rd |
1-1-0-0 |
50.0% |
100% |
100% |
| 4th |
1-0-1-1 |
33.3% |
33.3% |
66.7% |
| 5th |
0-0-0-3 |
0% |
0% |
0% |
| 6th-9th |
0-0-1-4 |
0% |
0% |
20.0% |
| 10th or lower |
0-0-0-5 |
0% |
0% |
0% |
| No G1 race contested |
0-0-0-15 |
0% |
0% |
0% |
Check races contested in autumn of previous year
Looking at performances by runners over the last three years in terms of G1 races contested in the autumn of the previous year, we find that runners that had contested either the Mile Championship or the Arima Kinen achieved high success ratios (no runners appeared in both races). In addition, the six runners that had contested either of these races all finished 5th or higher in that race. In other words, we should focus on runners that have entered the top places in the Mile Championship (a fierce battle of runners excelling in speed) and the Arima Kinen (a grand prix race that concludes the annual racing program). [Table 6]
[Table 6] Performance by appearance in G1 race held in autumn of previous year (last 3 years)
G1 race contested in
autumn of previous year |
Performance
[1st-2nd-3rd-4th or lower] |
Win ratio |
Top 2 ratio |
Top 3 ratio |
| Mile Championship |
1-1-0-3 |
20.0% |
40.0% |
40.0% |
| Arima Kinen(The Grand Prix) |
2-1-1-5 |
22.2% |
33.3% |
44.4% |
No appearance
in races above |
0-1-2-27 |
0% |
3.3% |
10.0% |
Note: No runners appeared in both the Mile Championship and Arima Kinen (The Grand Prix).
Seek out the winner!
Focus on number of races contested since October of the previous year
Looking at performances by runners over the last three years in terms of the number of races contested since October of the previous year, we find that the three winners had all contested three such races. It will be interesting to see if this trend continues in 2020, the fourth year in which the Osaka Hai is held as a G1 race. [Table 7]
[Table 7] Performance by number of races contested since October of previous year (last 3 years)
| Number of races |
1st finish |
2nd or lower finish |
| 3 |
3 runners |
15 runners |
| 2 or below, 4 or above |
0 runners |
26 runners |
(Michio Kawano)
|


