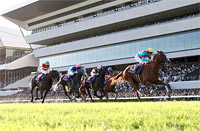
Kikuka Sho (Japanese St. Leger) (G1) - Data Analysis
Final hurdle in 3-year-old classics notable for strong performances by new names
Of the 36 winners in the Kikuka Sho (Japanese St. Leger) since 1984, when the grading system was introduced, 27 (three-quarters) notched their first G1 win in the race. While the seven consecutive winners since 2013 all achieved their first G1 victory in the race, none of the five runners that entered the race during the same period with a previous G1 victory on their record finished in the Top 3. In other words, this final leg of the classic Triple Crown requires different qualities from runners than the Satsuki Sho (Japanese 2000 Guineas) and Tokyo Yushun (Japanese Derby). Let’s now analyze some features shared by successful runners in this race based on results over the last 10 years.
Look for a strong performance last time out
Of the 30 Top 3 finishers over the last 10 years, 27 had finished in the “Top 3” of their previous race. Conversely, runners that had finished “4th or lower” struggled with a Top 3 ratio of 3.8%. We should therefore lower our expectations of runners that did not finish in the Top 3 of their previous race. [Table 1]
[Table 1] Performance by finish in the previous race (last 10 years)
| Finish in previous race |
Performance
[1st-2nd-3rd-4th or lower] |
Win ratio |
Top 2 ratio |
Top 3 ratio |
| Top 3 |
10-9-8-74 |
9.9% |
18.8% |
26.7% |
| 4th or lower |
0-1-2-76 |
0% |
1.3% |
3.8% |
“Closing speed” in previous race also a key factor
Of the 30 Top 3 finishers over the last 10 years, 24 had contested a JRA race last time out and were ranked “3rd or higher” in their estimated time over the final three furlongs in that race. Conversely, runners that were ranked “4th or lower” struggled with a Top 3 ratio of 6.7%. When comparing the details of the previous race, we should focus on the ranking in terms of the estimated time over the final three furlongs in that race [Table 2]
[Table 2] Among runners that had contested a JRA race last time out, performance by ranking in terms of estimated time over the final three furlongs in that race (last 10 years)
Ranking by estimated time
over final three furlongs |
Performance
[1st-2nd-3rd-4th or lower] |
Win ratio |
Top 2 ratio |
Top 3 ratio |
| 3rd or higher |
8-8-8-65 |
9.0% |
18.0% |
27.0% |
| 4th or lower |
2-2-2-84 |
2.2% |
4.4% |
6.7% |
In addition, if we limit our analysis to the years in which track conditions were “Good” over the last 10 years (eight years, excluding 2013 and 2017), we find that runners that had contested a JRA race last time out and were ranked “4th or lower” in their estimated time over the final three furlongs in that race achieved a Top 3 ratio of only 4.2%. If the track conditions are good this year, we should focus to an even greater extent on runners’ “closing speed” in their previous race. [Table 3]
[Table 3] Among runners that had contested a JRA race last time out in years with favorable track conditions over the last 10 years, performance by ranking in terms of estimated time over the final three furlongs in that race (8 years, excluding 2013 and 2017)
Ranking by estimated time
over final three furlongs |
Performance
[1st-2nd-3rd-4th or lower] |
Win ratio |
Top 2 ratio |
Top 3 ratio |
| 3rd or higher |
6-8-7-51 |
8.3% |
19.4% |
29.2% |
| 4th or lower |
2-0-1-68 |
2.8% |
2.8% |
4.2% |
Focus on runners that have performed well in G1 or G2 races
Of the 30 Top 3 finishers over the last 10 years, 26 had experience of finishing in the Top 4 of a “JRA G1 or G2 race held since April of the same year.” Meanwhile, runners without such experience struggled with a Top 3 ratio of 4.4%. This year, we should again raise our expectations of runners that have finished in the Top 4 of a JRA G1 or G2 race held since April. [Table 4]
[Table 4] Performance by experience of finishing in the Top 4 of “a JRA G1 or G2 race held since April of the same year” (last 10 years)
| Experience |
Performance
[1st-2nd-3rd-4th or lower] |
Win ratio |
Top 2 ratio |
Top 3 ratio |
| Yes |
9-10-7-63 |
10.1% |
21.3% |
29.2% |
| No |
1-0-3-87 |
1.1% |
1.1% |
4.4% |
Zero Top 2 finishers among runners that had contested a race other than a JRA graded race last time out
All 20 Top 2 finishers over the last 10 years had contested a “JRA graded race” in their previous race. Conversely, runners that had entered a “race other than a JRA graded race” produced zero Top 2 finishers and achieved a Top 3 ratio of only 8.9%. This suggests that runners coming straight from a race other than a JRA graded race are unlikely to chase the top places. [Table 5]
[Table 5] Performance by previous race (last 10 years)
| Previous race |
Performance
[1st-2nd-3rd-4th or lower] |
Win ratio |
Top 2 ratio |
Top 3 ratio |
| JRA graded race |
10-10-5-99 |
8.1% |
16.1% |
20.2% |
Race other than JRA
graded race |
0-0-5-51 |
0% |
0% |
8.9% |
In addition, among the 25 runners that had entered a “JRA graded race” in their previous race and finished in the Top 3 of that race, 18 had contested the Kobe Shimbun Hai (Japanese St. Leger Trial) in their previous race. Conversely, runners that came straight from the Asahi Hai St. Lite Kinen (Japanese St. Leger Trial) struggled with a Top 3 ratio of 9.6%. In other words, we should slightly lower our expectations of runners coming from the Asahi Hai St. Lite Kinen despite its status as a trial race for the Kikuka Sho. [Table 6]
[Table 6] Among runners that had contested a “JRA graded race” in their previous race, performance by previous race (last 10 years)
| Previous race |
Performance
[1st-2nd-3rd-4th or lower] |
Win ratio |
Top 2 ratio |
Top 3 ratio |
Kobe Shimbun Hai
(Japanese St. Leger Trial) |
8-6-4-46 |
12.5% |
21.9% |
28.1% |
Asahi Hai St. Lite Kinen
(Japanese St. Leger Trial) |
1-3-1-47 |
1.9% |
7.7% |
9.6% |
| Radio Nikkei Sho |
1-0-0-0 |
100% |
100% |
100% |
| Sapporo Kinen |
0-1-0-2 |
0% |
33.3% |
33.3% |
| Other race |
0-0-0-4 |
0% |
0% |
0% |
Runners with nine or more career starts have fared poorly in recent years
Of the 21 Top 3 finishers over the last seven years, 19 had “8 or fewer” career starts. Conversely, runners with “9 or more” career starts struggled with a Top 3 ratio of 4.1%. Up to 2012, runners with “9 or more” career starts performed reasonably well, but if trends in recent years are anything to go by, runners with comparatively shorter careers should be rated highly. [Table 7]
[Table 7] Performance by career starts (last 7 years)
| Total career starts |
Performance
[1st-2nd-3rd-4th or lower] |
Win ratio |
Top 2 ratio |
Top 3 ratio |
| 8 or fewer |
7-5-7-58 |
9.1% |
15.6% |
24.7% |
| 9 or more |
0-2-0-47 |
0% |
4.1% |
4.1% |
Seek out the winner!
Watch total career starts and previous race
The seven recent winners all had “7 or fewer career starts.” As the trend in Table 7 illustrates, we should not expect too much from runners with comparatively longer careers. Another shared feature among the seven winners was that they had entered their previous race with a body weight of 470kg or higher. This suggests we should lower our expectations of lighter horses. In addition, all seven winners finished in the Top 3 of a JRA graded race in their previous race. In other words, we should also focus on the trends outlined in Table 1 and Table 5. [Table 8]
[Table 8] Winners’ performance by career starts, body weight in previous race, and finish in previous race (last 7 years)
| Year |
Winner |
Total career starts |
Body weight in
previous race |
Previous race |
| 2013 |
Epiphaneia |
7 |
480kg |
Kobe Shimbun Hai
(Japanese St. Leger Trial) (G2), 1st |
| 2014 |
Toho Jackal |
6 |
484kg |
Kobe Shimbun Hai
(Japanese St. Leger Trial) (G2), 3rd |
| 2015 |
Kitasan Black |
6 |
532kg |
Asahi Hai St. Lite Kinen
(Japanese St. Leger Trial) (G2), 1st |
| 2016 |
Satono Diamond |
6 |
500kg |
Kobe Shimbun Hai
(Japanese St. Leger Trial) (G2), 1st |
| 2017 |
Kiseki |
7 |
486kg |
Kobe Shimbun Hai
(Japanese St. Leger Trial) (G2), 2nd |
| 2018 |
Fierement |
3 |
476kg |
Radio Nikkei Sho (G3), 2nd |
| 2019 |
World Premiere |
5 |
472kg |
Kobe Shimbun Hai
(Japanese St. Leger Trial) (G2), 3rd |
(Masaya Ibuki)
|


