Victoria Mile (G1) - Data Analysis
A gallop to the title of spring mile queen
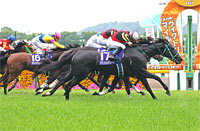
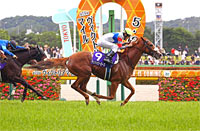
This race to decide the spring’s best filly and mare aged 4-and-up is contested on the 1,600m turf track at Tokyo Racecourse. With back-to-back wins in 2013 and 2014 by Verxina, followed by the same in 2015 and 2016 by Straight Girl, racing fans have been thrilled by some dramatic finishes in the Victoria Mile recently. Going further back, winners over the years include historic and famous names like Apapane, Buena Vista and Vodka. So who will be joining them as this year’s spring mile queen? As the battle approaches, let’s analyze some trends from results over the last 10 years.
Check the race record in January and February
First, let’s analyze performances over the last 10 years in terms of the runners’ highest finish in a race contested in the first two months of the year in question. Actually, 17 of the 30 Top 3 finishers in that time “Did not run” at all in January or February; horses in this category also have some of the highest success ratios in this race. But of those with experience of racing in January and February, six runners with a highest finish of “1st” have made it into the Top 3 here, while a total of five from the “6th-9th” and “10th or lower” groups have done the same. By contrast, no horse with a highest finish of “2nd-5th” has made it into the Top 2, and only two of them have finished 3rd. It should be interesting to check the runners’ records in January and February this year. [Table 1]
[Table 1] Performance by highest finish in Jan-Feb that year (last 10 years)
| Highest finish |
Performance
[1st-2nd-3rd-4th or lower] |
Win ratio |
Top 2 ratio |
Top 3 ratio |
| 1st |
1-4-1-27 |
3.0% |
15.2% |
18.2% |
| 2nd |
0-0-0-9 |
0% |
0% |
0% |
| 3rd |
0-0-0-7 |
0% |
0% |
0% |
| 4th |
0-0-2-6 |
0% |
0% |
25.0% |
| 5th |
0-0-0-5 |
0% |
0% |
0% |
| 6th- 9th |
1-1-0-19 |
4.8% |
9.5% |
9.5% |
| 10th or lower |
1-0-2-13 |
6.3% |
6.3% |
18.8% |
| Did not run |
7-5-5-63 |
8.8% |
15.0% |
21.3% |
Note: Includes NAR and overseas races.
Potential for a strong showing despite lower favoritism
Turning to performances by favoritism over the last 10 years, horses backed as “1st favorite” have racked up impeccable figures including a Top 2 ratio of 60.0%, while the “2nd-5th favorite” groups have been more or less on a par with each other. But we should not overlook the fact that 14 of the 30 Top 3 finishers in that time were backed as “6th favorite or lower.” In recent years alone, a runner billed as 6th favorite or lower has finished in the Top 2 in each of the last five years: 7th favorite Donau Blue finished 2nd in 2012, 12th favorite Whale Capture 2nd in 2013, 11th favorite Verxina 1st in 2014, 12th favorite Keiai Elegant 2nd in 2015, and 7th favorite Straight Girl 1st in 2016. We should be prepared for a standout performance by a horse with lower favoritism. [Table 2]
[Table 2] Performance by favoritism (last 10 years)
| Favoritism |
Performance
[1st-2nd-3rd-4th or lower] |
Win ratio |
Top 2 ratio |
Top 3 ratio |
| 1st favorite |
3-3-0-4 |
30.0% |
60.0% |
60.0% |
| 2nd favorite |
1-0-1-8 |
10.0% |
10.0% |
20.0% |
| 3rd favorite |
0-1-2-7 |
0% |
10.0% |
30.0% |
| 4th favorite |
1-0-1-8 |
10.0% |
10.0% |
20.0% |
| 5th favorite |
2-0-1-7 |
20.0% |
20.0% |
30.0% |
| 6th- 9th favorite |
1-3-3-33 |
2.5% |
10.0% |
17.5% |
| 10th favorite or lower |
2-3-2-82 |
2.2% |
5.6% |
7.9% |
Check the finish and time difference last time out
Looking at the performance of runners over the last 10 years by their finish in the previous race, those finishing “2nd or lower” in that race have higher success ratios than those finishing “1st.” In the last decade, the only Victoria Mile winner to finish 1st last time out was Asian Winds in 2008. [Table 3]
[Table 3] Performance by finish in previous race (last 10 years)
| Finish in previous race |
Performance
[1st-2nd-3rd-4th or lower] |
Win ratio |
Top 2 ratio |
Top 3 ratio |
| 1st |
1-2-3-30 |
2.8% |
8.3% |
16.7% |
| 2nd or lower |
9-8-7-119 |
6.3% |
11.9% |
16.8% |
Note: Includes NAR and overseas races.
Next, let’s aggregate performances of 143 horses beaten to “2nd or lower” last time out by the time difference behind the winner in that race. When the previous outing was a domestic race, the best Win ratio belongs to those with a time difference of “0.3-0.9 seconds” and the best Top 2 ratio to those with a difference of “1.0 second or more.” In other words, it seems we should be wary of rebound performances by runners suffering bad defeats last time out. Another point worth remembering is that six horses came straight from overseas races and four of them have finished in the Top 2 here. [Table 4]
[Table 4] Performance by time difference behind the winner last time out (last 10 years)
| Time difference |
Performance
[1st-2nd-3rd-4th or lower] |
Win ratio |
Top 2 ratio |
Top 3 ratio |
| 0.2 or less |
0-1-5-27 |
0% |
3.0% |
18.2% |
| 0.3-0.9 |
6-1-2-64 |
8.2% |
9.6% |
12.3% |
| 1.0 or more |
1-4-0-25 |
3.3% |
16.7% |
16.7% |
Note 1: Excludes runners coming straight from overseas races (2-2-0-2).
Note 2: Excludes one horse that was demoted after finishing 1st.
Check favoritism in G1 races
If we examine performances over the last 10 years by the runners’ highest favoritism in JRA G1 races contested within their last four outings, those with a highest ranking of “1st favorite” have by far the best success ratios here, including eight wins. Focusing on the Top 3 ratio, these are followed by the “2nd favorite” and “3rd favorite” groups, themselves some stretch ahead of the “4th favorite or lower” group. This just emphasizes the point that runners with experience of strong favoritism in recent JRA G1 races should not be overlooked. [Table 5]
[Table 5] Performance by highest favoritism in JRA G1 races within the last four outings (last 10 years)
| Highest favoritism |
Performance
[1st-2nd-3rd-4th or lower] |
Win ratio |
Top 2 ratio |
Top 3 ratio |
| 1st favorite |
8-2-1-11 |
36.4% |
45.5% |
50.0% |
| 2nd favorite |
0-2-0-8 |
0% |
20.0% |
20.0% |
| 3rd favorite |
0-1-1-6 |
0% |
12.5% |
25.0% |
| 4th favorite |
0-0-1-7 |
0% |
0% |
12.5% |
| 5th favorite |
0-1-0-7 |
0% |
12.5% |
12.5% |
| 6th-9th favorite |
0-0-1-19 |
0% |
0% |
5.0% |
| 10th favorite or lower |
0-1-2-14 |
0% |
5.9% |
17.6% |
| No G1 in last 4 races |
2-3-4-77 |
2.3% |
5.8% |
10.5% |
Seek out the winner!
Don’t dismiss horses with a disappointing finish last time out
All five winners since 2012 had been backed “among the top 5 favorites” in their previous outing but had finished below their ranking in favoritism. We shouldn’t necessarily have lower expectations of horses that were highly favored but failed to deliver last time out. [Table 6]
[Table 6] Winners’ favoritism and finish last time out (last 5 years)
| Year |
Winning horse |
Favoritism in last race |
Finish in last race |
| 2012 |
Whale Capture |
2nd favorite |
5th |
| 2013 |
Verxina |
4th favorite |
6th |
| 2014 |
Verxina |
5th favorite |
11th |
| 2015 |
Straight Girl |
1st favorite |
13th |
| 2016 |
Straight Girl |
3rd favorite |
9th |
(Michio Kawano)
|


