Yasuda Kinen (G1) - Data Analysis
Spring mile champion decider that brings together elite runners from different paths
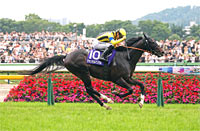
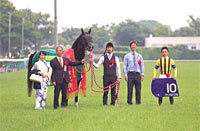
In 2020, Gran Alegria secured her second G1 victory in the Yasuda Kinen, went on to win the Sprinters Stakes and the Mile Championship in the autumn season, and received the JRA Award for Best Sprinter or Miler in the same year. In 2019, Indy Champ followed a similar trajectory, notching his first G1 win in the Yasuda Kinen, dominating the Mile Championship in the autumn season, and collecting the JRA Award for Best Sprinter or Miler in the same year. Many of the runners that converge at the Yasuda Kinen have come from sprint races, middle-distance races, and graded races for fillies, so the race always promises to be a thrilling spectacle. Let’s now analyze some features shared by successful runners in this race based on results over the last 10 years.
Runners with 30 or more career starts have fared poorly
All 30 Top 3 finishers over the last 10 years had “29 or fewer” career starts. This suggests we should probably lower our expectations of runners with 30 or more career starts. [Table 1]
[Table 1] Performance by total career starts (last 10 years)
| Total career starts |
Performance
[1st-2nd-3rd-4th or lower] |
Win ratio |
Top 2 ratio |
Top 3 ratio |
| 29 or fewer |
10-10-10-110 |
7.1% |
14.3% |
21.4% |
| 30 or more |
0-0-0-24 |
0% |
0% |
0% |
Watch favoritism in previous race
Of the 30 Top 3 finishers over the last 10 years, 21 runners had contested a domestic race in their previous race and had been backed as “4th favorite or higher” in that race. Conversely, runners that had been backed as “5th favorite or lower” in such a race struggled with a Top 3 ratio of 9.4%. Incidentally, when looking at the five years since 2016, runners that had been backed as 5th favorite or lower in their previous race delivered performance of [0-1-0-30] (Top 3 ratio of 3.2%). When comparing the previous race of the runners, we should concentrate on favoritism in that race. [Table 2]
[Table 2] Among runners that had contested a domestic race in their previous race, performance by favoritism in that race (last 10 years)
| Favoritism in previous race |
Performance
[1st-2nd-3rd-4th or lower] |
Win ratio |
Top 2 ratio |
Top 3 ratio |
| 4th favorite or higher |
9-6-6-60 |
11.1% |
18.5% |
25.9% |
| 5th favorite or lower |
0-3-3-58 |
0% |
4.7% |
9.4% |
Runners that performed strongly last time out have enjoyed success in recent years
When looking at performances over the last five years by runners that had contested a domestic race in their previous race in terms of their finish in that race and their time difference with the winner in that race, we find that runners that had finished 2nd or lower in their previous race with a time difference of 0.5s or more with the winner in that race were all beaten to 4th or lower. In other words, runners that were defeated in their previous race with a sizeable time difference with the winner in that race, have struggled in recent years. [Table 3]
[Table 3] Among runners that had contested a domestic race in their previous race, performance by finish and time difference with winner in that race (last five years)
Finish in previous race and
time difference with winner
in that race |
Performance
[1st-2nd-3rd-4th or lower] |
Win ratio |
Top 2 ratio |
Top 3 ratio |
| 1st, or 2nd or lower with time difference of 0.4s or less with winner |
5-4-4-33 |
10.9% |
19.6% |
28.3% |
| 2nd or lower with time difference of 0.5s or more with winner |
0-0-0-20 |
0% |
0% |
0% |
In addition, when looking at performances over the last five years by runners that had contested an overseas race in their previous race in terms of their finish in that race, we observe that runners that had finished “2nd or lower” last time out were all beaten to 4th or lower. When comparing runners that have contested an overseas race in their previous race, we should lower our expectations of those that were beaten in that race. [Table 4]
[Table 4] Among runners that had contested an overseas race in their previous race, performance by finish in that race (last five years)
| Finish in previous race |
Performance
[1st-2nd-3rd-4th or lower] |
Win ratio |
Top 2 ratio |
Top 3 ratio |
| 1st |
0-1-1-3 |
0% |
20.0% |
40.0% |
| 2nd or lower |
0-0-0-5 |
0% |
0% |
0% |
Course aptitude is a decisive factor
Of the 15 Top 3 finishers over the last five years, 12 had experience of “winning a race at Tokyo Racecourse since the previous year.” This suggests runners that have won a race at Tokyo Racecourse since 2020 are likely to chase the top places. [Table 5]
[Table 5] Experience of winning race at Tokyo Racecourse since previous year (last five years)
| Experience |
Performance
[1st-2nd-3rd-4th or lower] |
Win ratio |
Top 2 ratio |
Top 3 ratio |
| Yes |
3-5-4-22 |
8.8% |
23.5% |
35.3% |
| No |
2-0-1-39 |
4.8% |
4.8% |
7.1% |
In addition, the three Top 3 finishers without experience of “winning a race at Tokyo Racecourse since the previous year” had all achieved a “Top 2 finish after passing the 4th corner in 6th or higher position” in a 1,600m JRA G1 race. In other words, among runners that have not secured a victory at Tokyo Racecourse since last year, we need to discount those that have not achieved a Top 2 finish in a 1,600m G1 race after taking a front position. [Table 6]
[Table 6] Among runners without experience of winning race at Tokyo Racecourse since previous year, performance by experience of finishing in Top 2 of “1,600m JRA G1 race” after passing 4th corner in 6th or higher position (last five years)
| Experience |
Performance
[1st-2nd-3rd-4th or lower] |
Win ratio |
Top 2 ratio |
Top 3 ratio |
| Yes |
2-0-1-6 |
22.2% |
22.2% |
33.3% |
| No |
0-0-0-33 |
0% |
0% |
0% |
Seek out the winner!
Runners starting in Brackets 1 and 8 struggle to win
The last 10 winners of the Yasuda Kinen all started in Brackets 2-7. Over the last 10 years, runners starting in Bracket 1 delivered performance of [0-3-1-14] and those starting in Bracket 8 performance of [0-1-1-24], with both groups struggling to produce a winner. This suggests we should lower our expectations of runners starting in the inner- or outermost brackets. Other shared features among the last 10 winners were that they had 24 or fewer career starts, and that they had finished in their previous race either 1st, or 2nd or lower with a time difference with the winner of 0.4s or less. When predicting the potential winner, we should therefore also consider the trends in Table 1 and Table 3, in addition to the bracket number. [Table 7]
[Table 7] Winners’ bracket number, total career starts, finish in previous race, and time difference with winner in previous race (last 10 years)
Year |
Winner |
Bracket number |
Total career starts |
Finish in previous race |
Time difference with winner in previous race |
| 2011 |
Real Impact |
7 |
5 |
3rd |
0.3s |
| 2012 |
Strong Return |
2 |
18 |
4th |
0.3s |
| 2013 |
Lord Kanaloa |
5 |
15 |
1st |
- |
| 2014 |
Just a Way |
5 |
18 |
1st |
- |
| 2015 |
Maurice |
3 |
10 |
1st |
- |
| 2016 |
Logotype |
5 |
24 |
2nd |
No time difference |
| 2017 |
Satono Aladdin |
7 |
24 |
9th |
0.4s |
| 2018 |
Mozu Ascot |
5 |
10 |
2nd |
No time difference |
| 2019 |
Indy Champ |
3 |
9 |
4th |
0.2s |
| 2020 |
Gran Alegria |
7 |
7 |
2nd |
No time difference |
(Masaya Ibuki)
|


