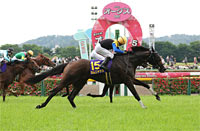
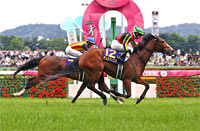
Yushun Himba (Japanese Oaks) (G1) - Data Analysis
Ultimate contest for 3-year-old fillies with ample room for upsets
In the 2021 Yushun Himba (Japanese Oaks), Uberleben finished 1st with win odds of 8.9 (3rd favorite), Akaitorino Musume 2nd with win odds of 4.5 (2nd favorite), and Hagino Pilina 3rd with win odds of 215.4 (16th favorite), producing a high Trifecta payout of 532,180 yen. Incidentally, in the eight races from 2013 to 2020, race favorites finished consistently in the Top 3, resulting in an average Trifecta payout of around 50,000 yen. Let’s now analyze some features shared by successful runners in this race based on results over the last 10 years.
Look for a strong performance in previous outing
Of the 30 Top 3 finishers over the last 10 years, 24 had finished in the Top 3 of their previous race. Conversely, runners that had finished 4th or lower struggled with a Top 3 ratio of 7.5%. This basically suggests that we should focus on runners that were strong performers in their previous outing. [Table 1]
[Table 1] Performance by finish in previous race (last 10 years)
| Finish in previous race |
Performance
[1st-2nd-3rd-4th or lower] |
Win ratio |
Top 2 ratio |
Top 3 ratio |
| Top 3 |
9-8-7-74 |
9.2% |
17.3% |
24.5% |
| 4th or lower |
1-2-3-74 |
1.3% |
3.8% |
7.5% |
In addition, if we limit our analysis to the last four years, all 12 Top 3 finishers had finished 4th or higher in their previous race. Based on trends in recent years, we should particularly lower our expectations of runners that have finished 5th or lower in their previous race. [Table 2]
[Table 2] Performance by finish in previous race (last four years)
| Finish in previous race |
Performance
[1st-2nd-3rd-4th or lower] |
Win ratio |
Top 2 ratio |
Top 3 ratio |
| 4th or higher |
4-4-4-30 |
9.5% |
19.0% |
28.6% |
| 5th or lower |
0-0-0-29 |
0% |
0% |
0% |
Front runners last time out fare poorly here
Of the 30 Top 3 finishers over the last 10 years, 29 had been positioned 3rd or lower when passing the 4th corner in their previous race. Conversely, runners that had been positioned 2nd or higher struggled with a Top 3 ratio of 4.2%. In other words, we should not expect too much from runners that contested their previous race in front position. [Table 3]
[Table 3] Performance by position when passing 4th corner in previous race (last 10 years)
| Position when passing 4th corner in previous race |
Performance
[1st-2nd-3rd-4th or lower] |
Win ratio |
Top 2 ratio |
Top 3 ratio |
| 2nd or higher |
0-0-1-23 |
0% |
0% |
4.2% |
| 3rd or lower |
10-10-9-125 |
6.5% |
13.0% |
18.8% |
Runners with 5 or fewer career starts have the edge
Of the 30 Top 3 finishers over the last 10 years, 25 had 5 or fewer career starts. Conversely, runners with 6 or more career starts struggled with a Top 3 ratio of 6.0%. This suggests runners with 6 or more career starts are unlikely to chase the top places. [Table 4]
[Table 4] Performance by total career starts (last 10 years)
| Total career starts |
Performance
[1st-2nd-3rd-4th or lower] |
Win ratio |
Top 2 ratio |
Top 3 ratio |
| 5 or fewer |
8-10-7-70 |
8.4% |
18.9% |
26.3% |
| 6 or more |
2-0-3-78 |
2.4% |
2.4% |
6.0% |
In addition, all five Top 3 finishers with 6 or more career starts came from sires that had experience of finishing in the Top 2 of the Tenno Sho (Spring) in their career. In other words, among runners with 6 or more career starts, we should not necessarily lower our expectations of those by sires that have performed well in long-distance races at an older age. [Table 5]
[Table 5] Among runners with “6 or more” career starts, performance by sire (last 10 years)
| Sire |
Performance
[1st-2nd-3rd-4th or lower] |
Win ratio |
Top 2 ratio |
Top 3 ratio |
| Sires with experience of finishing in the Top 2 of the Tenno Sho (Spring) in their career |
2-0-3-20 |
8.0% |
8.0% |
20.0% |
| Other sires |
0-0-0-58 |
0% |
0% |
0% |
Check the closing speed
Of the 21 Top 3 finishers over the last seven years, 15 had been ranked 3rd or higher in their estimated time over the final three furlongs last time out. Conversely, runners that had been ranked 4th or lower struggled with a Top 3 ratio of 7.8%. We should therefore check the closing time in the previous race. [Table 6]
[Table 6] Performance by ranking in terms of estimated time over final three furlongs last time out (last seven years)
| Ranking by estimated time over final three furlongs last time out |
Performance
[1st-2nd-3rd-4th or lower] |
Win ratio |
Top 2 ratio |
Top 3 ratio |
| 3rd or higher |
6-4-5-32 |
12.8% |
21.3% |
31.9% |
| 4th or lower |
1-3-2-71 |
1.3% |
5.2% |
7.8% |
In addition, among the six Top 3 finishers that had been ranked 4th or lower in their estimated time over the final three furlongs in their previous race, five had experience of “ranking 3rd or higher in their estimated time over the final three furlongs in a 1-win class or higher-ranked race at Tokyo Racecourse, and winning that race.” In other words, among runners that had been ranked 4th or lower in their estimated time over the final three furlongs last time out, we should not necessarily lower our expectations of those that have already won a race at Tokyo Racecourse with a good turn of foot. [Table 7]
[Table 7] Among runners that had been ranked 4th or lower in their estimated time over the final three furlongs last time out, performance by experience of “ranking 3rd or higher in their estimated time over the final three furlongs in a 1-win class or higher-ranked race at Tokyo Racecourse” (last seven years)
| Experience |
Performance
[1st-2nd-3rd-4th or lower] |
Win ratio |
Top 2 ratio |
Top 3 ratio |
| Yes |
1-2-2-9 |
7.1% |
21.4% |
35.7% |
| No |
0-1-0-62 |
0% |
1.6% |
1.6% |
Lighter horses have struggled in recent years
Of the 15 Top 3 finishers over the last five years, 13 had entered their previous race with a weight of 450kg or more. Meanwhile, runners that weighed less than 450kg in their previous race struggled with a Top 3 ratio of 6.1%. If trends in recent years are anything to go by, we should also check the body weight of the runners. [Table 8]
[Table 8] Performance by body weight in previous race (last five years)
| Body weight in previous race |
Performance
[1st-2nd-3rd-4th or lower] |
Win ratio |
Top 2 ratio |
Top 3 ratio |
| Less than 450kg |
0-1-1-31 |
0% |
3.0% |
6.1% |
| 450kg or more |
5-4-4-43 |
8.9% |
16.1% |
23.2% |
Seek out the winner!
Key factors are recent performance and body weight
The last four winners had all finished in the Top 3 of their previous race. Other shared features among these runners were that they had been ranked 4th or lower when passing the 4th corner in their previous race, that they had been ranked 1st in their estimated time over the final three furlongs in their previous race, and that they had entered their previous race with a weight of 450kg or more. In other words, we should refer to the trends in Tables 1-3, Table 6, and Table 8, and carefully consider recent performance and body weight in our analysis. [Table 9]
[Table 9] Winners’ finish in previous race, position when passing 4th corner in previous race, ranking by estimated time over final three furlongs in previous race, and body weight in previous race (last four years)
| Year |
Winner |
Finish in previous race |
Position when passing 4th corner in previous race |
Ranking by estimated time over final three furlongs in previous race |
Body weight in previous race |
| 2018 |
Almond Eye |
1st |
16th |
1st |
462kg |
| 2019 |
Loves Only You |
1st |
4th |
1st |
456kg |
| 2020 |
Daring Tact |
1st |
12th |
1st |
466kg |
| 2021 |
Uberleben |
3rd |
10th |
1st |
454kg |
(Masaya Ibuki)
|


