NHK Mile Cup (G1) - Data Analysis
Mile champion decider for three-year-olds in which poorly favored runners cannot be overlooked
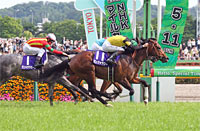
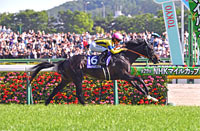
In the 2022 NHK Mile Cup, Danon Scorpion triumphed backed by win odds of 7.1 (4th favorite), Matenro Orion finished 2nd backed by win odds of 6.8 (3rd favorite), and Kawakita Reverie came in 3rd backed by win odds of 229.1 (18th favorite), producing a high Trifecta payout of 1,532,370 yen. In the 18 years since 2005, when Trifecta bets were introduced, the Trifecta payout for this race has exceeded 200,000 yen nine times, or in half of the races. Four of these races finished in a major upset with a Trifecta payout above 1,000,000 yen. This year, we should again be prepared for dark horses to rise to the top. Let’s now analyze some features shared by successful runners in this race based on results over the last 10 years.
Watch lead-up races
Looking at performances by runners over the last 10 years in terms of the distance of their previous race, we find that runners that had contested a race of above 1,800m last time out achieved a relatively strong Top 3 ratio of 33.3%. This suggests we should raise our expectations of runners in this group. [Table 1]
[Table 1] Performance by distance of previous race (last 10 years)
Distance of
previous race |
Performance
[1st-2nd-3rd-4th or lower] |
Win ratio |
Top 2 ratio |
Top 3 ratio |
| 1800m or less |
7-9-8-138 |
4.3% |
9.9% |
14.8% |
| above 1,800m |
3-1-2-12 |
16.7% |
22.2% |
33.3% |
In addition, looking at performances by runners that had contested a race of 1,800m or less last time out in terms of their previous race, we note that only the runners coming from the Oka Sho (Japanese 1000 Guineas), Arlington Cup, or Mainichi Hai achieved Top 3 ratios above 20%. These three races are all graded races held on the outer oval turf track of Hanshin Racecourse. We should therefore assume there is a relatively high probability that runners coming from these races will chase the top places. [Table 2]
[Table 2] Among runners that had contested a race of 1,800m or less in their previous race, performance by previous race (last 10 years)
| Previous race |
Performance
[1st-2nd-3rd-4th or lower] |
Win ratio |
Top 2 ratio |
Top 3 ratio |
| Oka Sho (Japanese 1000 Guineas) |
2-2-0-12 |
12.5% |
25.0% |
25.0% |
| New Zealand Trophy |
2-1-2-45 |
4.0% |
6.0% |
10.0% |
| Arlington Cup |
2-0-4-19 |
8.0% |
8.0% |
24.0% |
| Chunichi Sports Sho Falcon Stakes |
1-1-1-16 |
5.3% |
10.5% |
15.8% |
| Mainichi Hai |
0-2-0-7 |
0% |
22.2% |
22.2% |
| Other race |
0-3-1-39 |
0% |
7.0% |
9.3% |
Runners backed as race favorite in their previous race fare well
Looking at performances by runners over the last 10 years in terms of favoritism in their previous race, we observe that runners that had been backed as race favorite achieved a strong Top 3 ratio of 42.3%. When comparing the previous race of the runners, we should therefore focus on their favoritism in that race. [Table 3]
[Table 3] Performance by favoritism in previous race (last 10 years)
Favoritism in
previous race |
Performance
[1st-2nd-3rd-4th or lower] |
Win ratio |
Top 2 ratio |
Top 3 ratio |
| 1st favorite |
5-4-2-15 |
19.2% |
34.6% |
42.3% |
| 2nd favorite or lower |
5-6-8-135 |
3.2% |
7.1% |
12.3% |
Look for strong performance last time out
Of the 18 Top 3 finishers over the last six years, 15 had finished either 1st, or 2nd or lower with a time difference of 0.3s or less with the winner in their previous race. Conversely, runners that had finished 2nd or lower with a time difference of 0.4s or more with the winner in their previous race struggled with a Top 3 ratio of 6.3%. Up to 2016, runners coming straight from a major defeat also performed reasonably well, but if trends in recent years are anything to go by, strong performers last time out are likely to have the edge. [Table 4]
[Table 4] Performance by finish in previous race and time difference with winner in that race (last six years)
Finish in previous race and time
difference with winner in that race |
Performance
[1st-2nd-3rd-4th or lower] |
Win ratio |
Top 2 ratio |
Top 3 ratio |
1st, or 2nd or lower with time
difference with winner of 0.3s or less |
5-5-5-45 |
8.3% |
16.7% |
25.0% |
2nd or lower with time difference
with winner of 0.4s or more |
1-1-1-45 |
2.1% |
4.2% |
6.3% |
In addition, the runners that finished in the Top 3 despite having finished 2nd or lower with a time difference of 0.4s or more with the winner in their previous race, had all entered a race with a field of 17 or more runners in their previous race and had been backed as 12th favorite or higher in that race. Among runners that had a time difference of 0.4s or more with the winner in their previous race, we need to discount runners that had entered a race with a field of 16 or fewer runners or those that had been backed by extremely low favoritism in their previous race. [Table 5]
[Table 5] Among runners that had finished 2nd or lower in their previous race with a time difference of 0.4s or more with the winner of that race, performance by number of runners and favoritism in that race (last six years)
Number of runners and
favoritism in previous race |
Performance
[1st-2nd-3rd-4th or lower] |
Win ratio |
Top 2 ratio |
Top 3 ratio |
Field of 17 or more runners,
and 12th favorite or higher |
1-1-1-11 |
7.1% |
14.3% |
21.4% |
Field of 16 or fewer runners,
or 13 favorite or lower |
0-0-0-34 |
0% |
0% |
0% |
Runners starting in outer brackets have enjoyed success in recent years
Of the 18 Top 3 finishers in the last six years, 12 had entered the race with the numbers 10-18. Meanwhile, runners with the numbers 1-9 struggled somewhat with a Top 3 ratio of 11.1%. We should therefore favor runners starting in the outer brackets. [Table 6]
[Table 6] Performance by horse number (last six years)
| Horse number |
Performance
[1st-2nd-3rd-4th or lower] |
Win ratio |
Top 2 ratio |
Top 3 ratio |
| 1-9 |
0-3-3-48 |
0% |
5.6% |
11.1% |
| 10-18 |
6-3-3-42 |
11.1% |
16.7% |
22.2% |
Front runners in particular have had the edge in recent years
Of the nine Top 3 finishers over the last three years, six had been positioned 4th or higher when passing the 4th corner in their previous race. Conversely, runners that had been positioned 5th or lower struggled with a Top 3 ratio of 9.7%. [Table 7]
[Table 7] Performance by position when passing 4th corner in previous race (last three years)
Position when passing 4th
corner in previous race |
Performance
[1st-2nd-3rd-4th or lower] |
Win ratio |
Top 2 ratio |
Top 3 ratio |
| 4th or higher |
2-1-3-17 |
8.7% |
13.0% |
26.1% |
| 5th or lower |
1-2-0-28 |
3.2% |
9.7% |
9.7% |
In addition, the three runners that finished in the Top 3 despite being positioned 5th or lower when passing the 4th corner in their previous race, had all experience of “finishing 1st and being positioned 4th or higher when passing the 4th corner” in a JRA open-class race. This suggests we should lower our expectations of runners that have never won a graded or open-class race from a forward position, and had passed the 4th corner of their previous race in 5th or lower position. [Table 8]
[Table 8] Among runners that had been positioned 5th or lower when passing the 4th corner in their previous race, performance by experience of “finishing 1st and being positioned 4th or higher when passing the 4th corner” in a JRA open-class race (last three years)
| Experience |
Performance
[1st-2nd-3rd-4th or lower] |
Win ratio |
Top 2 ratio |
Top 3 ratio |
| Yes |
1-2-0-5 |
12.5% |
37.5% |
37.5% |
| No |
0-0-0-23 |
0% |
0% |
0% |
Seek out the winner!
Sluggish performance by runners that had been poorly favored in previous race
The recent six winners had all been backed as 6th favorite or higher in their previous race. We should therefore be wary of runners backed by extremely poor favoritism in their previous race. Other shared features among the last six winners were that they had won their previous race or finished 2nd or lower with a time difference of 0.4s or less with the winner in that race, and that they entered the NHK Mile Cup with the numbers 11-18. This suggests we should also take into consideration the trends shown in Table 3 to Table 6. [Table 9]
[Table 9] Winners’ favoritism in previous race, finish in previous race, time difference with winner in previous race, and horse number (last six years)
| Year |
Winner |
Favoritism in
previous race |
Finish in
previous race |
Time difference with
winner in previous race |
Horse number |
| 2017 |
Aerolithe |
6th favorite |
5th |
0.2s |
16 |
| 2018 |
Keiai Nautique |
1st favorite |
2nd |
0.0s |
11 |
| 2019 |
Admire Mars |
2nd favorite |
4th |
0.4s |
17 |
| 2020 |
Lauda Sion |
1st favorite |
2nd |
0.2s |
11 |
| 2021 |
Schnell Meister |
2nd favorite |
2nd |
0.2s |
15 |
| 2022 |
Danon Scorpion |
1st favorite |
1st |
- |
18 |
(Masaya Ibuki)
|


