Mile Championship (G1) - Data Analysis
Mile champion decider in which dark horses cannot be overlooked
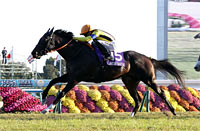
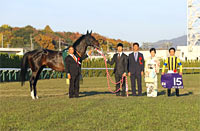
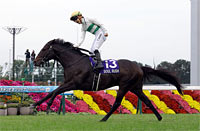
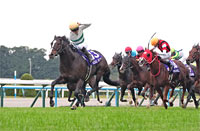
In last year’s Mile Championship, Namur, ridden by jockey Kota Fujioka and backed by win odds of 17.3 (5th favorite) charged forward with a terrific turn of speed from 15th position at the 4th corner to ultimately secure her first G1 victory. Although the Trifecta payouts in the seven races from 2015 to 2021 were all below 60,000 yen, they rose above 100,000 yen in the last two years: 142,650 yen in 2022, and 176,490 yen in 2023. Let’s now analyze some features shared by successful runners in this race based on results over the last 10 years, including the years from 2020 to 2022, when the Mile Championship was held as a 1,600m turf race at Hanshin Racecourse.
Look for strong performance last time out
Of the 30 Top 3 finishers over the last 10 years, 29 had finished 1st in their previous race, or been beaten to 2nd or lower with a time difference of 0.5s or less with the winner in that race. Conversely, runners that had finished 2nd or lower with a time difference of 0.6s or more with the winner in their previous race struggled with a Top 3 ratio of 1.6%. This means we should lower our expectations of runners coming straight from a defeat with a time difference of 0.6s or more with the winner. [Table 1]
[Table 1] Performance by finish in the previous race and time difference with the winner in that race (last 10 years)
Finish in previous race and time difference with winner
in that race |
Performance
[1st-2nd-3rd-4th or lower] |
Win ratio |
Top 2 ratio |
Top 3 ratio |
1st, or 2nd or lower with time difference of 0.5s or less
with winner |
9-10-10-80 |
8.3% |
17.4% |
26.6% |
2nd or lower with time difference of 0.6s or more
with winner |
1-0-0-62 |
1.6% |
1.6% |
1.6% |
Runners with 19 or more career starts have fared poorly
Of the 30 Top 3 finishers over the last 10 years, 28 had 18 or fewer career starts. Conversely, runners with 19 or more career starts struggled with a Top 3 ratio of 3.0%. In other words, we need to discount runners with 19 or more career starts. [Table 2]
[Table 2] Performance by total career starts (last 10 years)
| Total career starts |
Performance
[1st-2nd-3rd-4th or lower] |
Win ratio |
Top 2 ratio |
Top 3 ratio |
| 18 or fewer |
9-10-9-78 |
8.5% |
17.9% |
26.4% |
| 19 or more |
1-0-1-64 |
1.5% |
1.5% |
3.0% |
Strong performance by runners that were highly favored in their previous race
Looking at performances by runners in terms of favoritism in their previous race, we observe that runners that had been backed as 2nd favorite or higher achieved a high Top 3 ratio of 34.5%. Conversely, runners that had been backed as 7th favorite or lower were all beaten to 4th or lower. When comparing the recent race record of the runners, we should check their favoritism in the previous race. [Table 3]
[Table 3] Performance by favoritism in the previous race (last 10 years)
| Favoritism in previous race |
Performance
[1st-2nd-3rd-4th or lower] |
Win ratio |
Top 2 ratio |
Top 3 ratio |
| 2nd favorite or higher |
8-6-5-36 |
14.5% |
25.5% |
34.5% |
| 3rd-6th favorite |
2-4-5-56 |
3.0% |
9.0% |
16.4% |
| 7th favorite or lower |
0-0-0-50 |
0% |
0% |
0% |
Focus on racing record since June of this year
Of the 30 Top 3 finishers over the last 10 years, 26 had experience of finishing in the Top 4 of a graded race held at Tokyo, Nakayama, Kyoto, or Hanshin Racecourse since June of the same year. Conversely, runners without such experience struggled with a Top 3 ratio of 5.2%. If we limit our analysis to the five years since 2019, runners in this group delivered performance of [0-0-0-32] (Top 3 ratio of 0%), with no examples of strong performance. We should therefore lower our expectations of runners that have not turned in strong performance since June of this year. [Table 4]
[Table 4] Performance by experience of finishing in the Top 4 of a graded race held at Tokyo, Nakayama, Kyoto, or Hanshin Racecourse since June of the same year (last 10 years)
| Experience |
Performance
[1st-2nd-3rd-4th or lower] |
Win ratio |
Top 2 ratio |
Top 3 ratio |
| Yes |
9-9-8-69 |
9.5% |
18.9% |
27.4% |
| No |
1-1-2-73 |
1.3% |
2.6% |
5.2% |
Distance of previous race and track record in mile-long races are decisive factors
Of the 18 Top 3 finishers over the last six years, 10 had contested a race with a distance above 1,600m in their previous race. Runners that had contested a race with a distance above 1,600m achieved a Top 3 ratio of 33.3%. Meanwhile, runners that had contested a race with a distance of 1,600m or less struggled somewhat with a Top 3 ratio of 11.3%. [Table 5]
[Table 5] Performance by distance of the previous race (last six years)
| Distance of previous race |
Performance
[1st-2nd-3rd-4th or lower] |
Win ratio |
Top 2 ratio |
Top 3 ratio |
| 1,600m or less |
3-3-2-63 |
4.2% |
8.5% |
11.3% |
| Above 1600m |
3-3-4-20 |
10.0% |
20.0% |
33.3% |
In addition, of the eight runners that finished in the Top 3 despite having contested a race with a distance of 1,600m or less in their previous race, seven had experience of winning a 1,600m JRA G1 or G2 race since the previous year. This suggests we should be skeptical of runners coming from races with a distance of 1,600m or less, unless they have demonstrated their aptitude for the distance of this race by, for example, having won a mile-long G1 or G2. [Table 6]
[Table 6] Among runners that had contested a race with a distance of 1,600m or less in their previous race, performance by experience of winning a 1,600m JRA G1 or G2 race since the previous year (last six years)
| Experience |
Performance
[1st-2nd-3rd-4th or lower] |
Win ratio |
Top 2 ratio |
Top 3 ratio |
| Yes |
3-3-1-16 |
13.0% |
26.1% |
30.4% |
| No |
0-0-1-47 |
0% |
0% |
2.1% |
Seek out the winner!
No winners among runners coming from a race other than a G1 or G2 race
The last six winners had all contested a G1 or G2 race in their previous race. We can therefore assume that runners coming from another race are unlikely to pull off a victory. Other shared features among the six winners were that they had finished 1st, or 2nd or lower with a time difference of 0.4s or less with the winner in their previous race, that they had 14 or fewer career starts, that they had been backed as 3rd favorite or higher in their previous race, and that they had achieved a Top 2 finish as their highest finish in a graded race held at Tokyo, Nakayama, Kyoto, or Hanshin Racecourse since June of the same year. This suggests we should also take into consideration the trends shown in Tables 1, 2, 3, and 4. [Table 7]
[Table 7] Winners’ previous race (grade), finish in previous race (time difference with winner), total career starts, favoritism in previous race, and highest finish in a graded race held at Tokyo, Nakayama, Kyoto, or Hanshin Racecourse since June of the same year (last six years)
| Year |
Winner |
Grade of previous race |
Finish in
previous race
(time difference
with winner) |
Total
career
starts |
Favoritism in
previous race |
Highest finish in graded race
held at Tokyo, Nakayama,
Kyoto, or Hanshin
Racecourse since June of
same year |
| 2018 |
Stelvio |
Mainichi Okan (G2) |
2nd (0.2s) |
8 |
3rd favorite |
2nd (Mainichi Okan) |
| 2019 |
Indy Champ |
Mainichi Okan (G2) |
3rd (0.4s) |
11 |
3rd favorite |
1st (Yasuda Kinen) |
| 2020 |
Gran Alegria |
Sprinters Stakes (G1) |
1st |
9 |
1st
favorite |
1st (Sprinters Stakes, etc.) |
| 2021 |
Gran Alegria |
Tenno Sho (Autumn) (G1) |
3rd (0.2s) |
14 |
2nd favorite |
2nd (Yasuda Kinen) |
| 2022 |
Serifos |
Fuji Stakes (G2) |
1st |
7 |
1st
favorite |
1st (Fuji Stakes) |
| 2023 |
Namur |
Fuji Stakes (G2) |
1st |
12 |
1st
favorite |
1st (Fuji Stakes) |
(Masaya Ibuki)
|


