2015 News
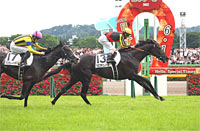
Data Analysis for the "2015 Tokyo Yushun (Japanese Derby) (G1)"A contest for the highest honor in Japanese racing In Japanese racing, everyone dreams of lifting the Tokyo Yushun (Japanese Derby). And for the horses, this is a life-defining event that can only be attempted at age 3. In 2013, Kizuna took the spoils after a late dash from wide on the final stretch. Last year, One and Only emerged from a breathtaking duel with Satsuki Sho (Japanese 2000 Guineas) winner Isla Bonita to take victory, in an epic contest befitting this highest pinnacle of Japanese racing. As we approach the next enthralling installment, let’s highlight some race trends based on results over the last 10 years. Recent record in graded races is important Let’s start by looking at the number of top 3 finishes in 1,600m+ turf graded races within the previous three outings by runners over the last 10 years. It turns out that all of the last 10 winners had finished in the top 3 at least twice in 1,600m+ turf graded races within their previous three outings. Horses with “Three” and “Two” top 3 finishes have superior success ratios to boot, while those with “None” have all been beaten to 4th or lower. This year, too, we should be sure to check the runners’ recent track record in graded races. [Table 1] [Table 1] Performance by number of top 3 finishes in 1,600m+ turf graded races within the previous three outings (last 10 years)
Dominance of horses with their previous two outings at the same racecourse Turning next to the venue for the previous two races entered by runners over the last 10 years, we find that those contesting their previous two races at the “Same” racecourse have achieved better success ratios than those appearing at “Different” racecourses. Incidentally, the three winners appearing at “Different” racecourses for their previous two races all won both of those races. [Table 2] [Table 2] Performance by venue of previous two races (last 10 years)
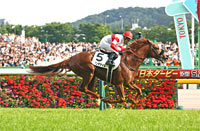
Inner horse numbers have the edge If we aggregate performances over the last 10 years by horse number, we find that numbers “1-4” have produced seven winners. In terms of success ratios, too, the figures are higher as the number approaches the inside, while conversely no winner has come from numbers “13-18”. In fact, horses with the number “1” have been extremely successful, with 4 wins and 1 runner-up spot over the last 10 years. When comparing horse numbers, our focus should be on the inner ones, and particularly horse number “1”. [Table 3] [Table 3] Performance by horse number (last 10 years)
Seek out the winners! A look at the recent track record of runners over the last 10 years shows that all ten winners had finished “1st” or “2nd” in their last-but-one race. Another feature shared by all ten winners is that they had all run in “G2” or “G3” races in that last-but-one race. Of course, as the Japanese Derby decides the best horse of its generation, every runner will already have garnered a degree of success. But it still seems worth checking the runners’ last-but-one race and their finish in it. [Table 4] [Table 4] Performance by finish in last-but-one race (last 10 years)
(Data analysis by Michio Kawano) |

|


