February Stakes (G1) - Data Analysis
Dirt champion decider of the spring season in which fancied runners tend to perform well
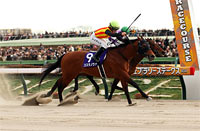
In the 2022 February Stakes, 2nd favorite Cafe Pharoah (win odds of 5.1) achieved a second consecutive victory, after also having triumphed in the 2021 race. In addition, 5th favorite T M South Dan (win odds of 8.9) finished as runner-up, and 4th favorite Sodashi (win odds of 8.2) in third place, producing a Trifecta payout of 76,940 yen. Payouts for the race have exceeded 100,000 yen five times in the 18 races since 2005, when Trifecta bets were introduced, and topped 200,000 yen only twice. Which runner will dominate in this race in which favored runners have historically had the edge, and thereby become the first JRA G1 winner of 2023? Let’s now analyze some features shared by successful runners in the race based on results in the last 10 years.
Course aptitude is key
Of the 30 Top 3 finishers in the last 10 years, 27 had experience of winning “a graded race below 1,900m run on a left-handed JRA course.” Conversely, runners without such experience struggled with a Top 3 ratio of 4.3%. In addition, if we limit our analysis to the eight years since 2015, runners without the aforementioned experience delivered performance of [0-1-1-55] (Top 3 ratio of 3.5%). In other words, we should focus on runners’ track record in graded races below 1,900m run on a left-handed course. [Table 1]
[Table 1] Performance by experience of winning “a graded race below 1,900m run on a left-handed JRA course” (last 10 years)
| Experience |
Performance
[1st-2nd-3rd-4th or lower] |
Win ratio |
Top 2 ratio |
Top 3 ratio |
| Yes |
9-9-9-62 |
10.1% |
20.2% |
30.3% |
| No |
1-1-1-66 |
1.4% |
2.9% |
4.3% |
Sluggish performances by runners with long careers
Of the 30 Top 3 finishers in the last 10 years, 24 had 25 or fewer career starts. Conversely, runners with 26 or more career starts struggled with a Top 3 ratio of 9.5%. [Table 2]
[Table 2] Performance by total career starts (last 10 years)
| Total career starts |
Performance
[1st-2nd-3rd-4th or lower] |
Win ratio |
Top 2 ratio |
Top 3 ratio |
| 25 or fewer |
10-7-7-71 |
10.5% |
17.9% |
25.3% |
| 26 or more |
0-3-3-57 |
0% |
4.8% |
9.5% |
In addition, of the six Top 3 finishers with 26 or more career starts, five had experience of finishing in the Top 4 of an earlier February Stakes. We should therefore lower our expectations of runners with 26 or more career starts unless they have already finished in the Top 4 of the February Stakes in the past. [Table 3]
[Table 3] Among runners with 26 or more career starts, performance by experience of finishing in the Top 4 of an earlier February Stakes (last 10 years)
| Experience |
Performance
[1st-2nd-3rd-4th or lower] |
Win ratio |
Top 2 ratio |
Top 3 ratio |
| Yes |
0-2-3-17 |
0% |
9.1% |
22.7% |
| No |
0-1-0-40 |
0% |
2.4% |
2.4% |
Watch favoritism in previous race
Of the 30 Top 3 finishers in the last 10 years, 24 had contested a domestic race in which they were backed as 4th favorite or higher in their previous race. Conversely, runners that had been backed as 5th favorite or lower in such a race struggled with a Top 3 ratio of 9.7%. When comparing the previous race of the runners, we should check their favoritism in that race. [Table 4]
[Table 4] Among runners that had contested a domestic race in their previous race, performance by favoritism in that race (last 10 years)
| Favoritism in previous race |
Performance
[1st-2nd-3rd-4th or lower] |
Win ratio |
Top 2 ratio |
Top 3 ratio |
| 4th favorite or higher |
9-7-8-71 |
9.5% |
16.8% |
25.3% |
| 5th favorite or lower |
1-3-2-56 |
1.6% |
6.5% |
9.7% |
Zero Top 3 finishes for runners starting in “innermost” or “outermost” brackets
Looking at performances by runners in the last 10 years in terms of their horse number, we find that runners starting in the “innermost” or “outermost” brackets were all beaten to 4th or lower. The last runner to finish in the Top 3 despite starting in the “innermost bracket” was 2004 runner-up Silent Deal, and the last runner to finish in the Top 3 despite starting in the “outermost bracket” was 2012 winner Testa Matta. This suggests we need to discount horses starting in the innermost or outermost brackets. [Table 5]
[Table 5] Performance by horse number (last 10 years)
| Horse number |
Performance
[1st-2nd-3rd-4th or lower] |
Win ratio |
Top 2 ratio |
Top 3 ratio |
| Innermost bracket |
0-0-0-10 |
0% |
0% |
0% |
| Outermost bracket |
0-0-0-10 |
0% |
0% |
0% |
| Other |
10-10-10-108 |
7.2% |
14.5% |
21.7% |
Runners with a previous Top 2 finish in a G1 race have had an edge in recent years
Of the 15 Top 3 finishers in the last five years, nine had experience of finishing in the Top 2 of a JRA G1 race. Runners in this group achieved an excellent Top 3 ratio of 36.0%. We should accordingly raise our expectations of runners with a previous Top 2 finish in a G1 race. [Table 6]
[Table 6] Performance by experience of finishing in the Top 2 of a JRA G1 race (last five years)
| Experience |
Performance
[1st-2nd-3rd-4th or lower] |
Win ratio |
Top 2 ratio |
Top 3 ratio |
| Yes |
3-4-2-16 |
12.0% |
28.0% |
36.0% |
| No |
2-1-3-47 |
3.8% |
5.7% |
11.3% |
In addition, the six Top 3 finishers without experience of finishing in the Top 2 of a JRA G1 race had all entered “a JRA graded race in their previous race, and finished in the Top 6 of that race.” When comparing runners without experience of finishing in the Top 2 of a G1 race, we should prioritize those that entered a JRA graded race in their previous race and finished in the Top 6 of that race. [Table 7]
[Table 7] Among runners without experience of finishing in the Top 2 of a JRA G1 race, performance by previous race and finish in that race (last five years)
| Previous race and finish in that race |
Performance
[1st-2nd-3rd-4th or lower] |
Win ratio |
Top 2 ratio |
Top 3 ratio |
| JRA graded race with Top 6 finish |
2-1-3-17 |
8.7% |
13.0% |
26.1% |
Race other than JRA graded race,
or 7th place or lower finish |
0-0-0-30 |
0% |
0% |
0% |
Seek out the winner!
No winners among runners coming from a NAR race in recent years
The last 10 winners had all contested a JRA race in their previous race. The last runner to secure a victory coming from a non-JRA race was Success Brocken in 2009. We should therefore lower our expectations of runners that had previously contested a NAR dirt race or other non-JRA race. Other shared features among the last 10 winners were that they had 20 or fewer careers starts, and that they had entered the race with the numbers 2-14. This suggests we should also take into consideration the trends shown in Tables 2 and 5. [Table 8]
[Table 8] Winners’ performance by previous race, total career starts, and horse number (last 10 years)
| Year |
Winner |
Previous race |
Total career starts |
Horse number |
| 2013 |
Grape Brandy |
JRA race |
15 |
2 |
| 2014 |
Copano Rickey |
JRA race |
8 |
13 |
| 2015 |
Copano Rickey |
JRA race |
15 |
4 |
| 2016 |
Moanin |
JRA race |
6 |
14 |
| 2017 |
Gold Dream |
JRA race |
8 |
3 |
| 2018 |
Nonkono Yume |
JRA race |
20 |
12 |
| 2019 |
Inti |
JRA race |
7 |
6 |
| 2020 |
Mozu Ascot |
JRA race |
20 |
12 |
| 2021 |
Cafe Pharoah |
JRA race |
6 |
3 |
| 2022 |
Cafe Pharoah |
JRA race |
10 |
6 |
(Masaya Ibuki)
|


