Yasuda Kinen (G1) - Data Analysis
A fitting climax to the spring mile racing program
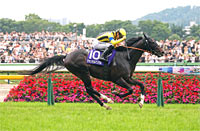
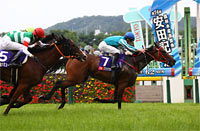
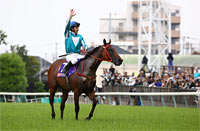
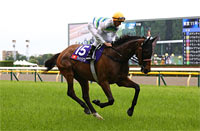
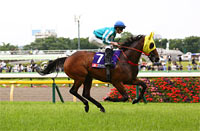
The Yasuda Kinen is the last of five G1 races to be held at Tokyo Racecourse in the spring program. In recent years, this race has been won by some famous horses with plenty of success in big races overseas - Lord Kanaloa in 2013, Just A Way in 2014, and Maurice in 2015. Now let’s look at results over the last 10 years in search of some trends in this race, the spring mile champion decider.
Dominance of “Top 2 finishers” in most previous outing
If we aggregate performances by runners over the last 10 years in terms of their finish in their previous outing, we find that all 10 winners in that time had finished “In the Top 4” last time out. What’s more, seven of the 10 runners-up had finished “In the Top 2” in their previous race. This trend has merely intensified since 2013, with seven out of eight Top 2 finishers in that time finishing “In the Top 2” last time out. Of course, we should not overlook the fact that runners in the “6th-9th” group have a Top 3 ratio of 19.0%, only just behind that of the “1st” group (19.5%). But even then, our primary focus should still be on horses finishing strongly in their previous outing. [Table 1]
[Table 1] Performance by finish in the previous race (last 10 years)
| Finish in previous race |
Performance
[1st-2nd-3rd-4th or lower] |
Win ratio |
Top 2 ratio |
Top 3 ratio |
| 1st |
5-3-0-33 |
12.2% |
19.5% |
19.5% |
| 2nd |
2-4-0-22 |
7.1% |
21.4% |
21.4% |
| 3rd |
2-0-4-18 |
8.3% |
8.3% |
25.0% |
| 4th |
1-0-1-19 |
4.8% |
4.8% |
9.5% |
| 5th |
0-0-3-11 |
0% |
0% |
21.4% |
| 6th-9th |
0-3-1-17 |
0% |
14.3% |
19.0% |
| 10th or lower |
0-0-1-22 |
0% |
0% |
4.3% |
Be prepared for a strong showing by unfavored runners
Viewing aggregate performances in terms of favoritism over the last 10 years, the best success ratios belong to horses backed as “1st-3rd favorite.” On the other hand, all 10 runners finishing 3rd had started the race as “3rd favorite or lower,” and eight of these were in fact “6th favorite or lower.” A horse backed as “6th favorite or lower” has finished in the Top 3 in each of the last 10 years; last year, the “8th favorite” Logotype held off a strong challenge from Maurice, the favorite with win odds of 1.7-1, for a sensational victory. We should always be prepared for a strong showing by unfavored runners. [Table 2]
[Table 2] Performance by favoritism (last 10 years)
| Favoritism |
Performance
[1st-2nd-3rd-4th or lower] |
Win ratio |
Top 2 ratio |
Top 3 ratio |
| 1st favorite |
4-1-0-5 |
40.0% |
50.0% |
50.0% |
| 2nd favorite |
3-1-0-6 |
30.0% |
40.0% |
40.0% |
| 3rd favorite |
0-3-1-6 |
0% |
30.0% |
40.0% |
| 4th favorite |
0-0-0-10 |
0% |
0% |
0% |
| 5th favorite |
0-2-1-7 |
0% |
20.0% |
30.0% |
| 6th-9th favorite |
3-1-3-33 |
7.5% |
10.0% |
17.5% |
| 10th favorite or lower |
0-2-5-75 |
0% |
2.4% |
8.5% |
Watch for runners coming from G1 and G3
In performances over the last 10 years by condition of the previous race, six of the winners in that time had most recently contested “G1” races and two had last been seen in a “G3” race. “G2” races have produced 91 runners but only one winner. On the other hand, runners last seen in G2 races have achieved by far the largest number of 2nd and 3rd place finishes (16 altogether) and marginally the best Top 3 ratio. It seems a good idea to bear in mind that the winner, runner-up and third-placed horse in this race can be influenced by vastly different conditions of the previous race. [Table 3]
[Table 3] Performance by condition of previous race (last 10 years)
| Condition of previous race |
Performance
[1st-2nd-3rd-4th or lower] |
Win ratio |
Top 2 ratio |
Top 3 ratio |
| G1 |
6-3-1-46 |
10.7% |
16.1% |
17.9% |
| G2 |
1-7-9-74 |
1.1% |
8.8% |
18.7% |
| G3 |
2-0-0-9 |
18.2% |
18.2% |
18.2% |
| Open special |
1-0-0-12 |
7.7% |
7.7% |
7.7% |
| Earning up to ¥1.6 m |
0-0-0-1 |
0% |
0% |
0% |
Note: “G1”, “G2” and “G3” include overseas races and NAR dirt grade races.
Don’t discount horses without a recent win
Turning finally to performances over the last 10 years by the number of wins in the last four outings, runners with “3 or more” wins in that time have recorded easily the highest success ratios here. They are followed by the group with “2 wins,” revealing a tendency for horses with more recent wins to be more successful here. Nevertheless, in recent years, those with “0 wins” at all in their last four outings have produced respectable performances, too; they include last year’s winner Logotype and 3rd-place finisher Fiero. In fact, horses from the “0 wins” category have finished in the Top 3 for six straight years since 2011. We would do well not to overlook runners without any wins in their recent record. [Table 4]
[Table 4] Performance by wins in the last four outings (last 10 years)
| Number of wins |
Performance
[1st-2nd-3rd-4th or lower] |
Win ratio |
Top 2 ratio |
Top 3 ratio |
| 3 or more |
3-2-0-6 |
27.3% |
45.5% |
45.5% |
| 2 |
2-2-2-24 |
6.7% |
13.3% |
20.0% |
| 1 |
2-3-3-59 |
3.0% |
7.5% |
11.9% |
| 0 |
3-3-5-53 |
4.7% |
9.4% |
17.2% |
Seek out the winner!
Check favoritism in the most recent JRA race
All six winners since 2011 had been backed “Among the Top 4 favorites” in their most recent JRA race. It might be interesting to check the runners’ favoritism in their most recent JRA race, to see if this trend will continue this year. [Table 5]
[Table 5] Winners’ favoritism in the most recently contested JRA race (last 6 years)
| Year |
Wining horse |
Favoritism |
| 2011 |
Real Impact |
4th favorite |
| 2012 |
Strong Return |
2nd favorite |
| 2013 |
Lord Kanaloa |
1st favorite |
| 2014 |
Just A Way |
2nd favorite |
| 2015 |
Maurice |
1st favorite |
| 2016 |
Logotype |
4th favorite |
(Michio Kawano)
|


