Hopeful Stakes (G1) - Data Analysis
Final graded race of the year that brings strong expectations for the next year
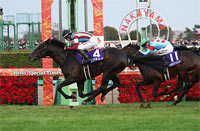
The G1 Hopeful Stakes for 2-year-olds will conclude the JRA graded race season this year. True to its name, the race brings together runners with promising future prospects. For example, 2019 winner Contrail won the Triple Crown the following year, while 2018 winner Saturnalia triumphed in the Satsuki Sho (Japanese 2000 Guineas) in 2019. Let’s now look for some trends in this race based on data for the last five years, during which the race was held as a G1 race.
Runners backed by high favoritism are solid
Highly favored runners have performed well in the Hopeful Stakes since the race was upgraded to G1 status, with race favorites producing four winners. Although last year’s race favorite Command Line was unable to notch the win, the victory went to 2nd favorite Killer Ability. Conversely, runners backed as 5th favorite or lower only finished in the Top 3 twice. In other words, runners backed by high favoritism tend to have the edge. [Table 1]
[Table 1] Performance by favoritism (last five years)
| Favoritism |
Performance
[1st-2nd-3rd-4th or lower] |
Win ratio |
Top 2 ratio |
Top 3 ratio |
| 1st favorite |
4-0-0-1 |
80.0% |
80.0% |
80.0% |
| 2nd favorite |
1-1-1-2 |
20.0% |
40.0% |
60.0% |
| 3rd favorite |
0-2-1-2 |
0% |
40.0% |
60.0% |
| 4th favorite |
0-2-1-2 |
0% |
40.0% |
60.0% |
| 5th favorite or lower |
0-0-2-51 |
0% |
0% |
3.8% |
Focus on runners with two or more wins
Of the 10 Top 2 finishers over the last five years, nine had achieved two or more previous wins. Last year’s winner Killer Ability only had one previous victory, but we should keep in mind that runners with only one previous win have often failed to live up to high favoritism. For example, 2nd favorite Lucas in 2017 (one previous win) finished 6th, while 3rd favorite Flatley in 2017 (one previous win) finished 13th. [Table 2]
[Table 2] Performance by number of wins in JRA races (last five years)
| Number of wins |
Performance
[1st-2nd-3rd-4th or lower] |
Win ratio |
Top 2 ratio |
Top 3 ratio |
| 2 or more |
4-5-4-17 |
13.3% |
30.0% |
43.3% |
| 1 or less |
1-0-1-41 |
2.3% |
2.3% |
4.7% |
Top 2 finish last time out is preferable
All of the 15 Top 3 finishers over the last five years had finished in the Top 2 of their previous race. The data suggests that runners that have been beaten to 3rd or lower in their previous race (regardless of class or grade) are likely to struggle. [Table 3]
[Table 3] Performance by finish in previous race (last five years)
| Finish in previous race |
Performance
[1st-2nd-3rd-4th or lower] |
Win ratio |
Top 2 ratio |
Top 3 ratio |
| 1st |
3-5-5-35 |
6.3% |
16.7% |
27.1% |
| 2nd |
2-0-0-5 |
28.6% |
28.6% |
28.6% |
| 3rd or lower |
0-0-0-18 |
0% |
0% |
0% |
In addition, looking at performances by runners that had finished in the Top 2 of their previous race in terms of favoritism in that race, we find a significant gap in success ratios between runners backed as 1st favorite and those backed as 2nd favorite or lower. We therefore need to focus on runners that were backed as 1st favorite in their previous race and finished in the Top 2 of that race. [Table 4]
[Table 4] Among runners that had finished in the Top 2 of their previous race, performance by favoritism in that race (last five years)
| Favoritism in previous race |
Performance
[1st-2nd-3rd-4th or lower] |
Win ratio |
Top 2 ratio |
Top 3 ratio |
| 1st favorite |
5-3-2-7 |
29.4% |
47.1% |
58.8% |
| 2nd favorite or lower |
0-2-3-33 |
0% |
5.3% |
13.2% |
Focus on runners known for final sprint
One indicator of the racing capabilities of young horses is their ranking by estimated time over the final three furlongs. We note a significant gap in success ratios between runners ranked 2nd or higher and those ranked 3rd or lower in their estimated time over the final three furlongs in their previous race. Moreover, of the 15 Top 3 finishers over the last five years, 13 had experience of covering the final three furlongs in less than 34.4 seconds. [Table 5]
[Table 5] Performance by ranking in terms of estimated time over final three furlongs last time out (last five years)
| Ranking |
Performance
[1st-2nd-3rd-4th or lower] |
Win ratio |
Top 2 ratio |
Top 3 ratio |
| 1st |
2-3-4-19 |
7.1% |
17.9% |
32.1% |
| 2nd |
3-1-1-10 |
20.0% |
26.7% |
33.3% |
| 3rd or lower |
0-1-0-28 |
0% |
3.4% |
3.4% |
Note: Excluding runners that had contested a NAR race in previous race.
Seek out the winner!
Watch runners that contested their debut race early in the year, and performance in 1800m+ races
The Hopeful Stakes is a G1 race in which runners that have contested their debut race early in the year fare well. Four of the last five winners had contested their debut race in the summer, three of which in June. In addition, four of the five winners had won an 1800m+ open-class or graded race, while the remaining runner (Killer Ability) had finished in 2nd place in the Hagi Stakes, and won a 2,000m turf maiden race in record time. [Table 6]
[Table 6] Winners’ debut month and performance in major 1800m+ open-class race (last five years)
| Year |
Winner |
Debut month |
Performance in 1800m+ races |
| 2017 |
Time Flyer |
August |
Hagi Stakes, 1st |
| 2018 |
Saturnalia |
June |
Hagi Stakes, 1st |
| 2019 |
Contrail |
September |
Tokyo Sports Hai Nisai Stakes, 1st |
| 2020 |
Danon the Kid |
June |
Tokyo Sports Hai Nisai Stakes, 1st |
| 2021 |
Killer Ability |
June |
Hagi Stakes, 2nd |
(Yodohito Himezono)
|


